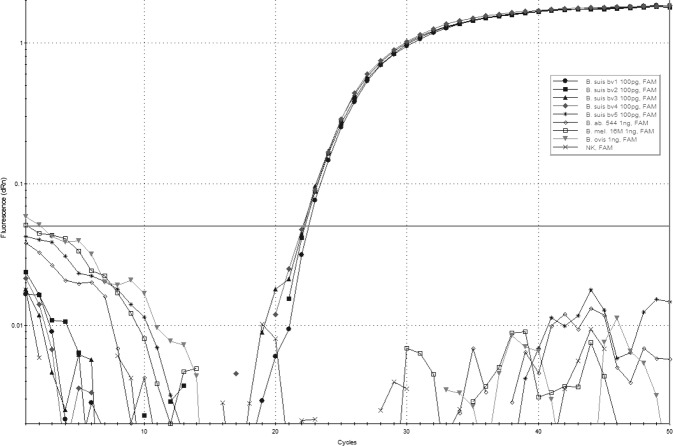
FIG 6:
Amplification curves of B. suis bv 1–4 (100 pg/µl DNA) with Ct values from 22.08 to 22.52 and of B. suis bv 5, B. abortus, B. melitensis and B. ovis (1 ng/µl DNA). Raw data were processed with an adaptive baseline correction and a moving average of three amplification points. The threshold was set to 0.05 (dRn)

