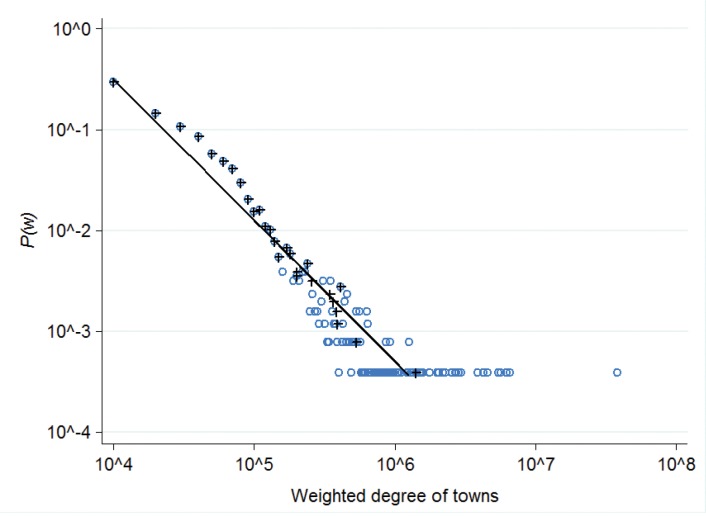
Fig 1. Degree distribution.
Weighted degree distribution of town network, loops excluded. Weights are the total number of user-to-user links between two towns. Weighted degrees were binned into 104 intervals for P(w) calculation; blue hollow circle symbols represent the bins; black plus symbols represent the mean of weighted degree by each unique value of P(w). The slope of the solid line is -1.4, which fits P(w) values with R2 = 0.66.

