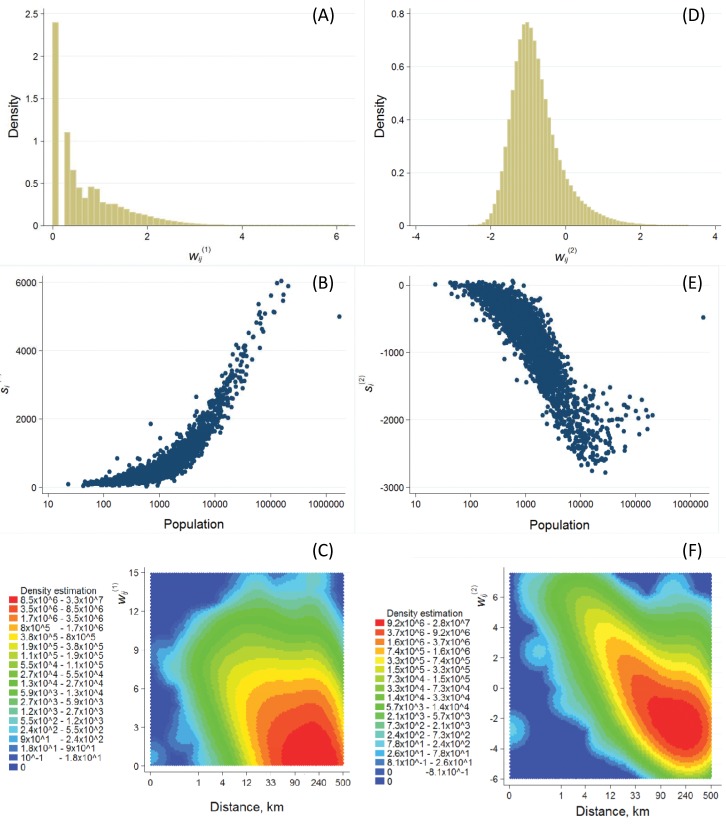
Fig 3. Edge weight and node strength distributions.
(A) The distribution of weights is unimodal and with a maximum at the value of 1. The tail ends at 7.68 indicating that a large fraction of the ties represent very low number of connections compared to a small set of high links indicating large number of personal ties. (B) Node strength s (1) rises as population increases. The capital, Budapest with its 2 million inhabitants is an outlier. (C) The heat map of the density of as a function of and the distance between towns i and j shows a complex distribution that is dominated by a large number of weak ties between distant locations. (D) has a unimodal distribution with values between –2.61 and 3.29 and with a modus at –0.77. (E) Node strength s (2) decreases as population increases but fluctuation is high across large towns. Budapest is again an outlier. (F) The heat map of the density of as a function of and the distance between towns i and j illustrates that the highest edge weights are between towns that are in geographical proximity.

