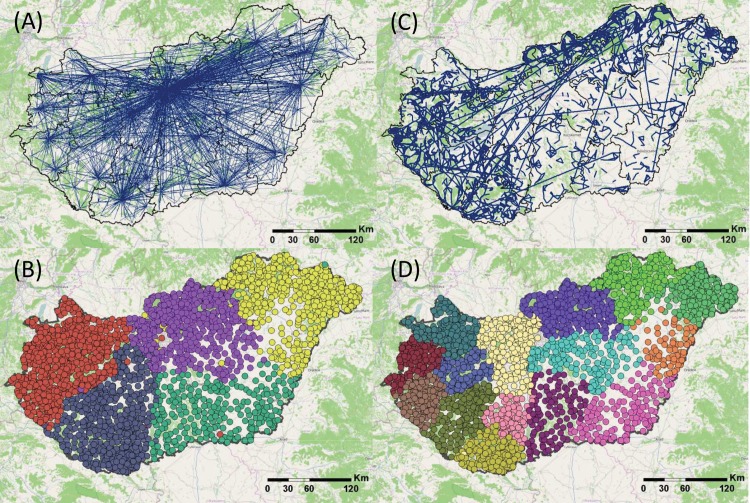
Fig 4. Spatial structure and modularity.
(A) The strongest 0.3% of all edges are depicted in network (4,081 edges). (B) The Louvain method finds 5 modules in the network; towns belonging to the same module are depicted with same colors. (C) The strongest 0.3% of all edges are depicted in network (4,081 edges). (D) The illustrated community structure contains 14 modules in the network. This community structure has the highest modularity index out of the Louvain algorithm runs we present in Table 2. Towns belonging to the same module are depicted with same colors. Created by own data, with base map of OpenStreetMap cartography licensed as CC BY-SA.

