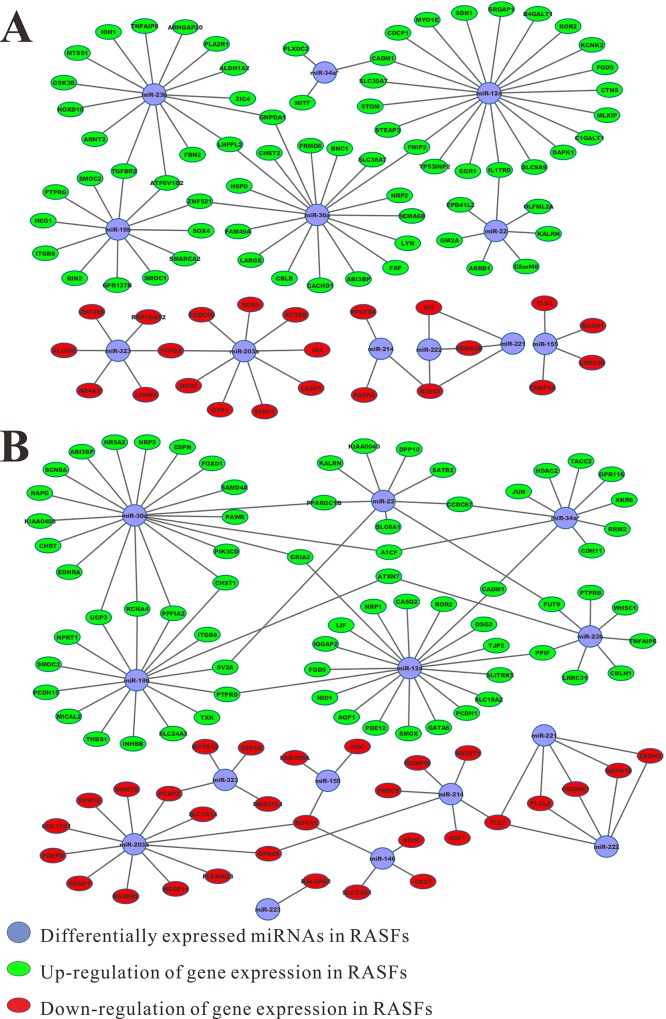
Fig 2. Genetic interaction networks for mRNA/microRNA (miRNA) pair candidates.
The dysregulated RA-associated miRNAs are indicated in blue, and miRNAs targeting up and downregulated genes are represented by red and green, respectively. A) miRNA-mRNA interaction network from microarray data; B) miRNA-mRNA interaction network from RNA-seq data.

