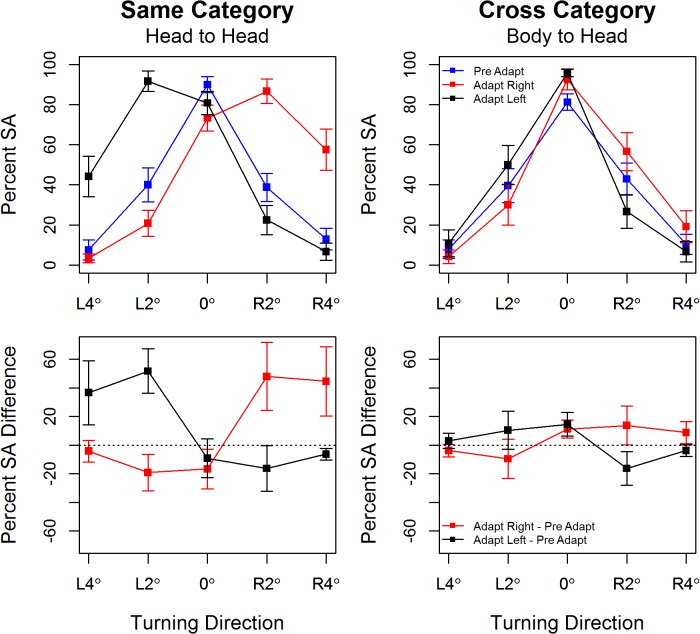
Fig 3. Top Panel: Percentage straight ahead responses by test head orientation in Experiment 2.
Error bars show +/1 S.E.M. Bottom Panel: Mean difference in the percentage of straight ahead responses pre- and post-adaptation by test body orientation. Error bars show 95% confidence intervals around the mean.

