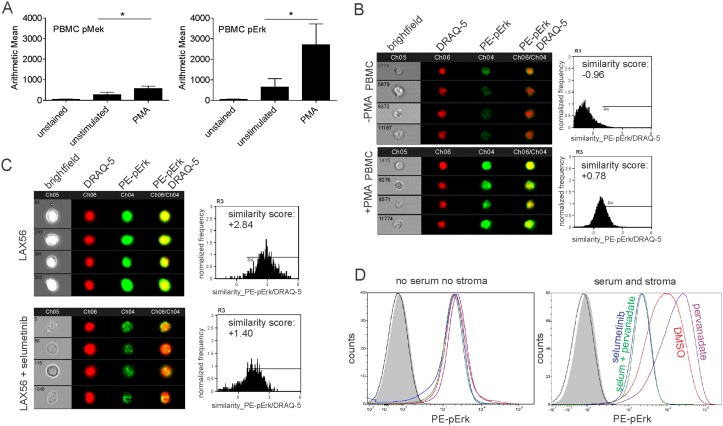
Fig 2. Phospho-flow cytometry detects Mek pathway activation and inhibition.
(A) PBMC from normal donors were stimulated with 40 nM PMA for 15 minutes, then analyzed by phospho-flow. Left, pMek, right pErk. Error bars, mean ± SD of 3 independent samples. *p<0.05, Student's t-test. (B, C) Imaging cytometry analysis on PBMC not stimulated (B top) or stimulated with 40 nM PMA (B bottom) or LAX56 cells treated with DMSO (C, top) or 10 μM selumetinib (C, bottom) for 10 minutes. (B, C) left, representative images; right, summary plot. Analysis of 3500 to 20,000 events per condition; numbers in the brightfield images represent the number designation of the individual event shown. (D) Histograms of pErk1/2 phospho-flow analysis on TXL2 ALL cells cultured without stroma or FBS (left panel), or on OP9 stroma + 20% FBS (right panel), for 24 hours. Cells were treated for 4 hours with solvent DMSO (red), with 100 μM sodium pervanadate (purple), with 10 μM selumetinib (blue), or with 100 μM sodium pervanadate, plus 10 μM selumetinib (green) as indicated. Grey histograms, unstained controls; black line, secondary antibody only. Single analysis.

