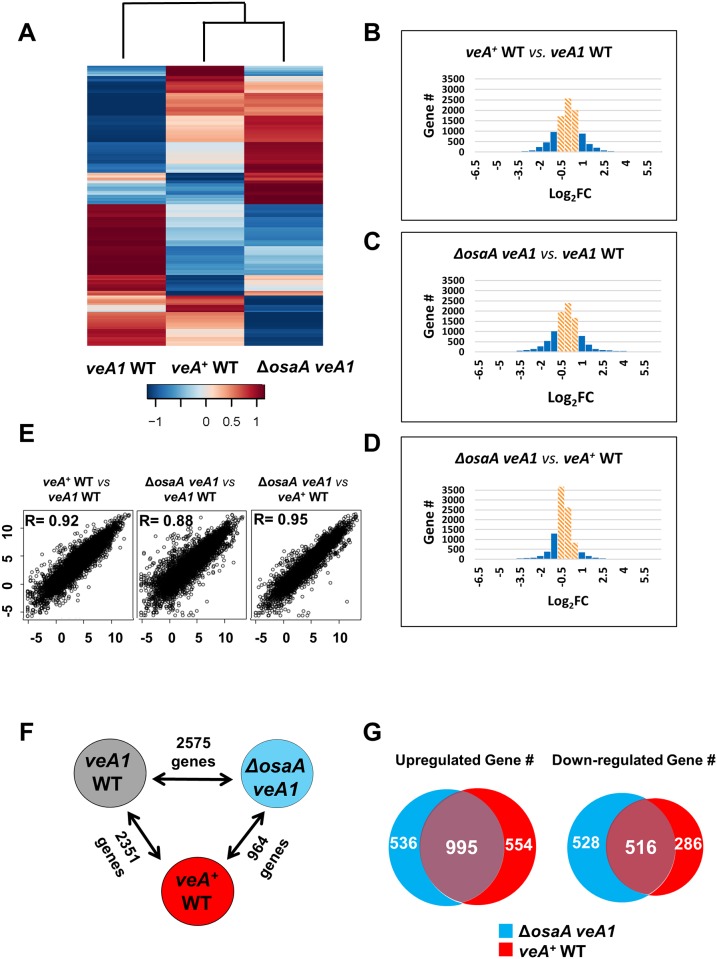
Fig 4. Genome-wide expression correlations among veA1 WT, veA + WT and ΔosaA veA1.
The included genes all have an FDR value less than 0.05 and fall in the -1<log2FC<1 fragment count range, unless indicated otherwise. (A) Heat map illustration of expression level changes among veA1 WT, veA + WT and ΔosaA veA1 strains. RPKM values were used for hierarchical clustering of genes. Scale bar shows the RPKM values (Z-score). In all analyses veA1 WT was used as a reference. (B, C, and D) Histograms showing general transcriptomic results of three analytical sets, veA + WT vs veA1 WT, ΔosaA veA1 vs veA1 WT and ΔosaA veA1 vs veA + WT, respectively. Columns in orange diagonal lines fall in the 1>log2FC>-1 fragment count range with low differential expression values. (E) Linear fitted models showing the correlation between three analytical sets, veA + WT vs veA1 WT, ΔosaA veA1 vs veA1 WT and ΔosaA veA1 vs veA + WT. The correlation coefficient R is indicated within each model. (F) The numbers of genes showing differential expression between two strains. (G) Venn diagrams showing up- and down-regulated genes in ΔosaA veA1 and veA + WT relative to veA1 WT. The numbers of common and unique genes are indicated.

