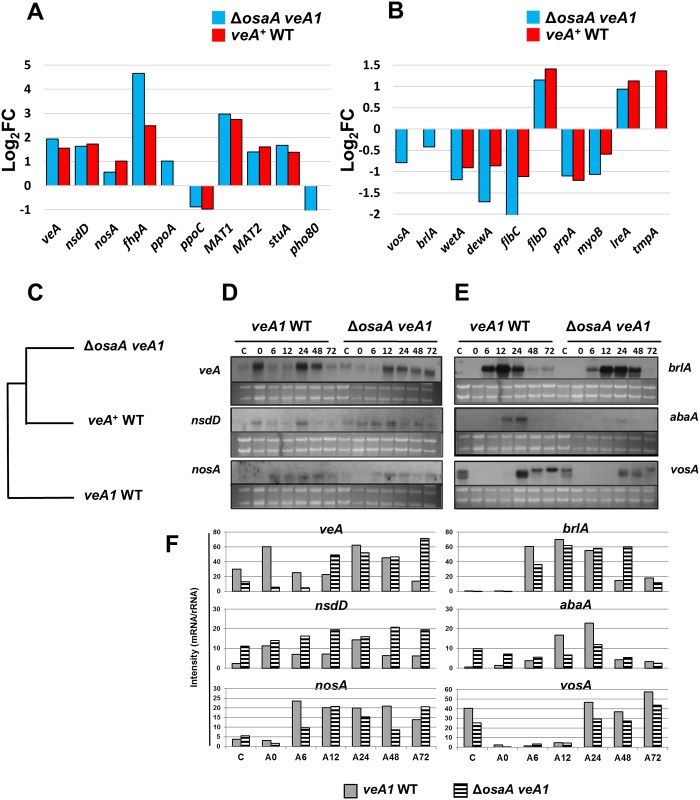
Fig 5. Influence of OsaA on expression of developmental genes.
(A) A histogram showing log2FC values of select sexual regulators in veA + WT and ΔosaA veA1 relative to veA1 WT. (B) A histogram showing log2FC values of select asexual regulators in veA + WT and ΔosaA veA1 relative to veA1 WT. (C) Phylogenetic analysis of select developmental gene expression changes among veA1 WT, veA + WT and ΔosaA veA1 strains. Only those genes with significant changes in pair-wise comparisons (p-value < = 5%) were analyzed using their RPKM values for hierarchical clustering. (D) Northern blot showing mRNA accumulation levels of three sexual activators, veA, nsdD, and nosA, in veA1 WT and ΔosaA veA1. (E) Northern blot showing mRNA accumulation levels of three asexual regulators, brlA, abaA and vosA, in veA1 WT and ΔosaA veA1. (F) Densitometry analysis of the northern blot data shown in (Fig 5D and 5E). Band intensity was estimated in reference to the rRNA levels using imageJ software [46].

