
Fig 1. Schematic diagram showing the genetic location of ISEcp upstream of bla CTX-M-15.
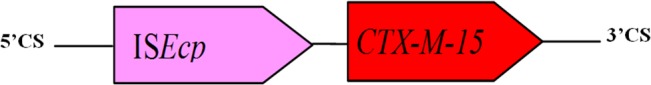
The arrows indicate the direction of transcription.
Official websites use .gov
A
.gov website belongs to an official
government organization in the United States.
Secure .gov websites use HTTPS
A lock (
) or https:// means you've safely
connected to the .gov website. Share sensitive
information only on official, secure websites.
The arrows indicate the direction of transcription.