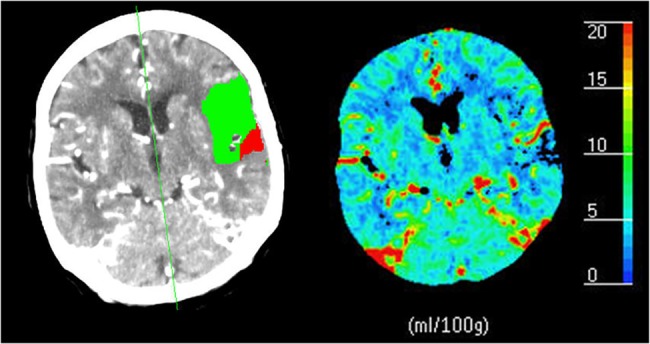
Fig 1. A typical CT perfusion summary map and blood volume map.

An example of a thick slice (5 mm) CTP summary map (left) for acute stroke assessment of a patient with an occluded left middle cerebral artery. The red area indicates the infarct core and the green area indicates the penumbra (tissue at risk). The right parameter map shows the cerebral blood volume (CBV). Both maps were generated by the Philips EBW 4.0 Brain Perfusion software (Philips Healthcare, Best, The Netherlands). The thresholds for the infarct core and penumbra were respectively CBV < 2.0 mL/100g and MTT > 145% of the contralateral side, as suggested by Wintermark et al. [11].
