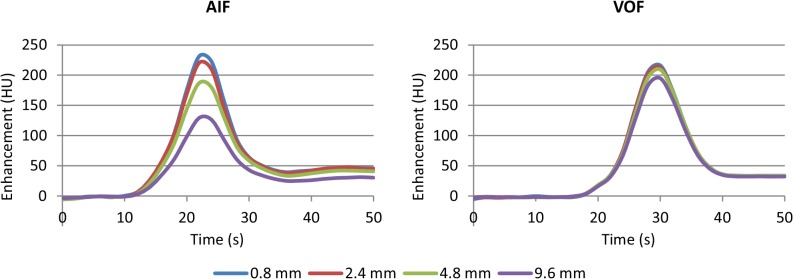
Fig 3. Arterial input functions and venous output functions.

The mean arterial input function (AIF, left) and venous output function (VOF, right) at different slice thicknesses. Scheme 2 (see Table 1) was used for processing this data. Before averaging all AIFs and all VOFs were aligned to their time-to-peak. The areas under the curves are listed in Table 3.
