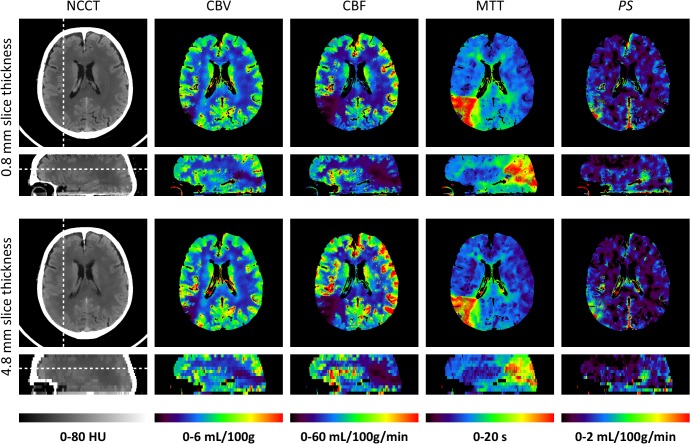
Fig 4. Thin and thick slice perfusion maps.
An example of axial and sagittal reformatted non-contrast CT (NCCT) slices and perfusion maps with an axial slice thickness of 0.8 mm (top row) and 4.8 mm (bottom row). Scheme 2 (bilateral filtering, see Table 1) was used for processing this data. The slice positions are indicated by a dashed line in the NCCT images. The cerebral blood volume (CBV) map shows a right posterior infarct core (low blood volume), whereas the cerebral blood flow (CBF) and mean transit time (MTT) maps clearly show the surrounding penumbra (low blood flow and elevated transit time). An elevated permeability-surface area product (PS) suggests increased vascular permeability. The 4.8 mm axial slices show slightly elevated CBF and CBV values, and decreased MTT values. The 4.8 mm sagittal slices have a pixelated appearance due to the anisotropic voxels. The raw sagittal slices are shown in Fig 2.

