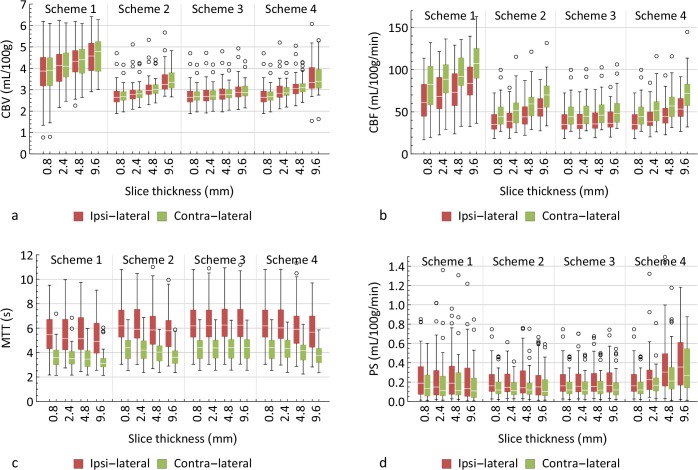
Fig 5. Absolute perfusion values in the ipsilateral and contralateral hemispheres.
Box plots showing the absolute perfusion values that were measured in the tissue within the ipsilateral hemisphere (red) and in the contralateral hemisphere (green). Outliers, marked by circles, are defined as points that are more than 1.5× the interquartile range above the 75% quartile or below the 25% quartile.

