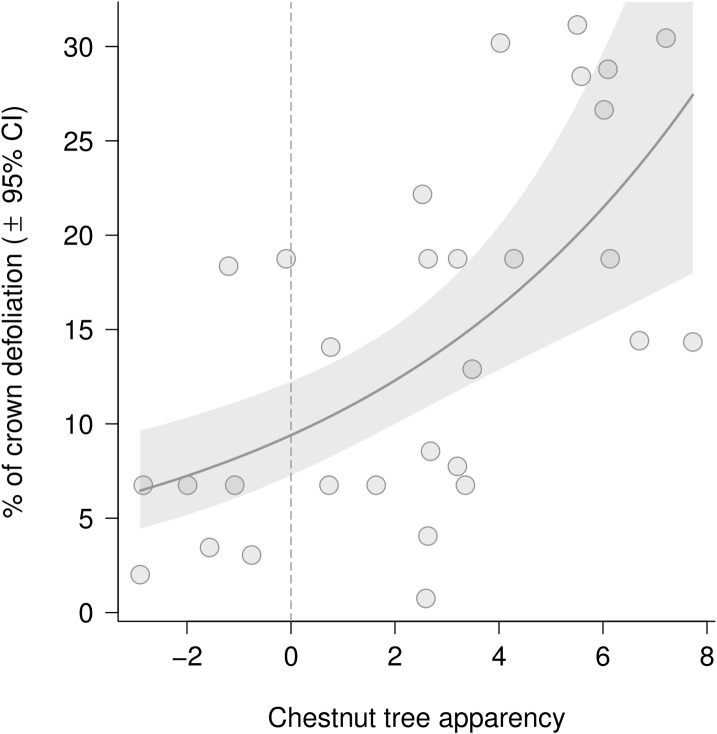
Fig 2. Relationship between total defoliation by Dryocosmus kuriphilus and chestnut tree apparency at the neighborhood level.
Dots represent the percentage of total tree defoliation. The solid line and shaded area represent predictions by linear mixed models and corresponding confidence intervals. Dots on the left hand side and right hand side represent chestnut trees that were on average shorter and taller than their neighbors, respectively.

