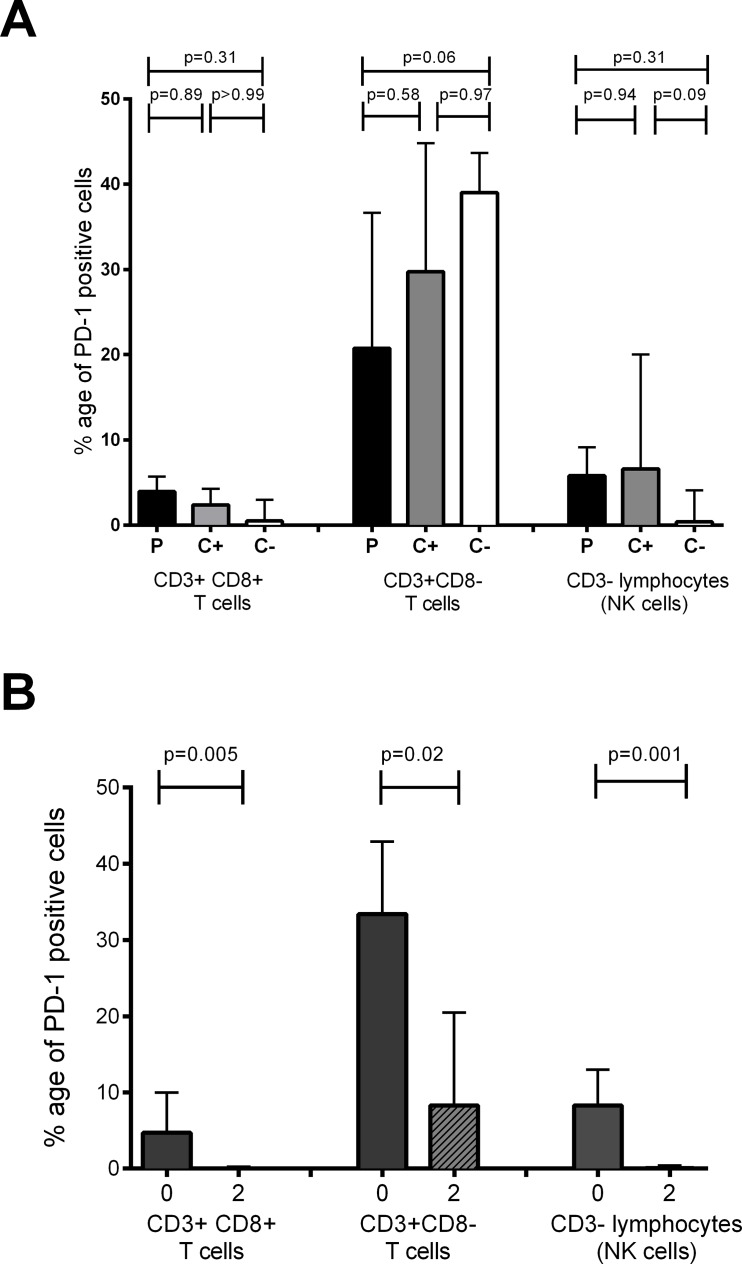
Fig 3. PD-1 protein expression during active TB disease and chemotherapy.
Frozen PBMCs from Pakistan were thawed and stained to analyse PD-1 protein expression. (A) PD-1 protein expression on CD3+CD8+ T cells, CD3+CD8- T cells and CD3- lymphocytes at diagnosis in 18 TB patients (moderate severity) (P), 7 latently infected contacts (C+) and 5 uninfected contacts (C-). P values are derived from the Kruskal-Wallis test with Dunn’s multiple testing correction. (B) Modulation of PD-1 protein expression on CD3+CD8+ T cells, CD3+CD8- T cells and CD3- lymphocytes with the intensive phase of chemotherapy in patients who were sputum smear negative after 2 months of treatment (n = 11), analysed with the Wilcoxon signrank test. The bars show medians and the interquartile range.

