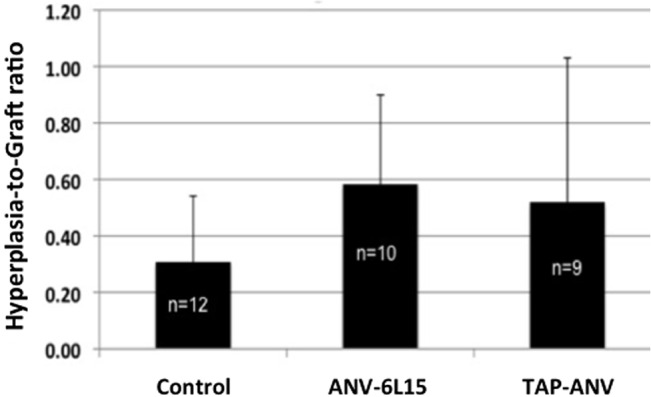
Fig 7. Effect of anti-thrombotic fusion protein treatment on hyperplasia-to-graft (H/G) ratios determined by histomorphometry.

Control = heparin-treated. A value of 1.0 would indicate the graft was fully occluded with hyperplasia. A value of 0.0 would indicate no hyperplasia. There was no significant difference in the H/G ratio amongst the treatments groups. The bars represent means ± SD.
