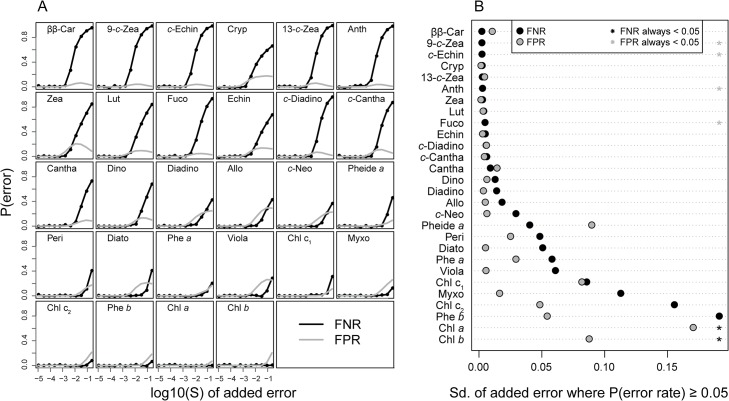
Fig 2. Results from the Monte-Carlo simulation of pigment detectability.
In A), the course of the false negative rate (FNR; black line) and the false positive rate (FPR; grey line) as the standard deviation of the random error is increased (see text), is shown for each pigment. The pigments were sorted from highest to lowest FNR, also shown in B). Here, we estimated how high the added random noise had to be for the FNR and FPR to exceed 0.05 (5%). Black dots represent the standard deviation of this random error for the FNR, the grey dots for the FNR. Asterisks mean that the FNR (black asterisks) or FPR (grey asterisks) never exceeded 5% for that pigment.

