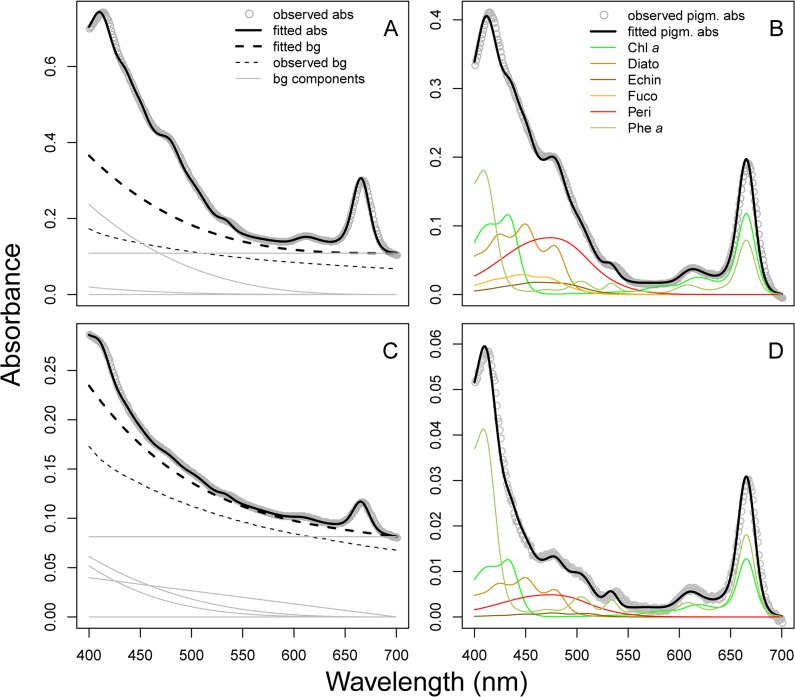
Fig 3. Absorbance spectra measured on sediment extracts.
Data from two depths in the sediment column is shown: A) and B) are from the upper cm, C) and D) from 5 cm below the sediment surface. The difference in absorbance between the two samples can be attributed to lower pigment concentrations deeper in the sediment. A & C) The measured total absorbance spectrum (grey dots) overlaid with the fitted total absorbance spectrum obtained using the modified-GPS method (solid black line). Background spectra (scattering and/or absorbance by non-algal pigment) are represented by dotted lines; the thick line being the modelled background, while the thin line is the measured blank spectrum (absorbance of a well filled with 96% ethanol). Thin grey lines represent the different component spectra making up the modelled background spectrum. In B) and D), the modelled background spectrum is subtracted from the total spectrum, yielding only pigment absorbance. The spectra of the individual pigments recognized by the modified-GPS method are shown in colour.

