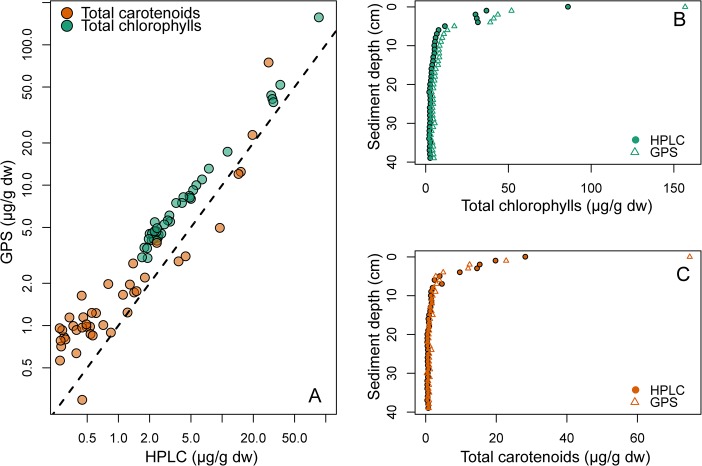
Fig 4. Total chlorophylls and total carotenoids from sediment.
A) Concentrations (μg pigment per gram sediment dry weight) of total chlorophylls (green) and total carotenoids (orange) as estimated by modified-GPS (y-axis) and HPLC (x-axis). The dotted line shows the 1:1 relationship. Note that both axes are log-transformed due to the large variation in concentrations. Pigment concentrations decreased with sediment depth, both total chlorophylls (B) and total carotenoids (C).

