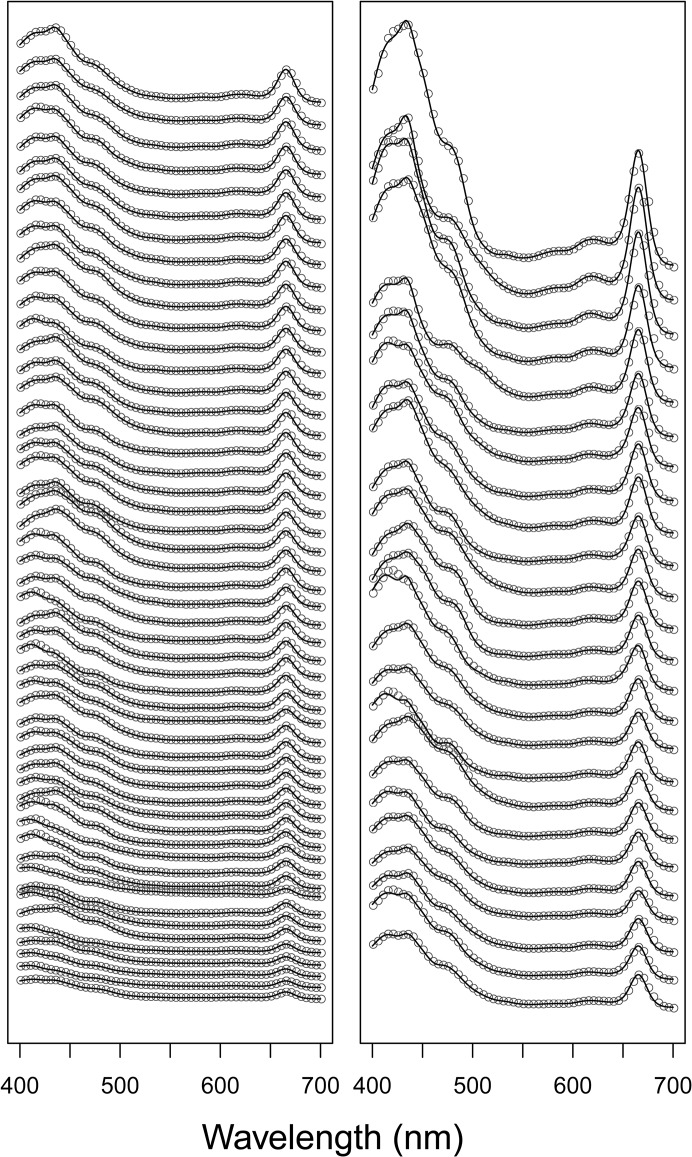
Fig 5. Observed and fitted spectra from lake samples.
Absorbance spectra from the 75 natural lake samples (not normalized to unit path-length) plotted as grey dots. For clarity, spectra are ordered from lowest to highest maximum absorbance, and dots plotted only for every fifth nm. A vertical offset is added between each spectrum, therefore no units on the y-axis. Fitted spectra are added as black lines.

