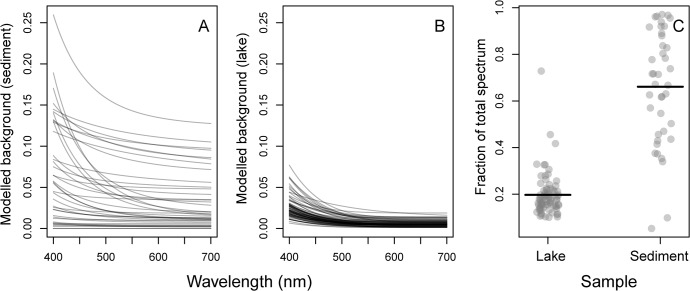
Fig 9. Modelled background spectra (scattering, and/or absorption by non-algal components) estimated after subtracting the microplate blank spectrum from the raw absorbance spectra.
A) Sediment samples (n = 40) and B) natural lake samples (n = 75). Each grey line represents the modelled background spectrum from one sample. C) The fraction of the total spectrum constituted by the background spectrum. It was calculated by dividing the integral under each background spectrum by the integral under the corresponding total (pigment + background) spectrum. Horizontal line equals mean fractions. The background constituted a higher and more variable fraction in the sediment samples.

