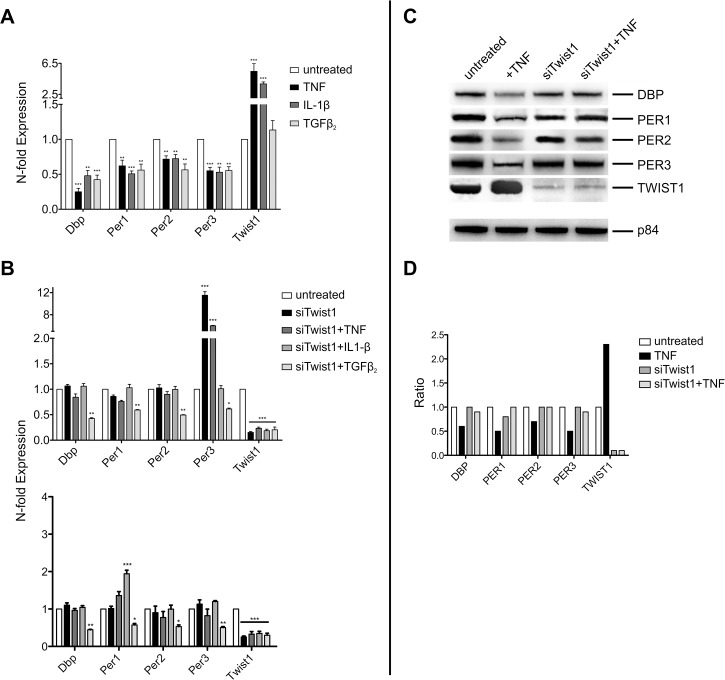
Fig 2. siRNA against Twist1 prevent from inhibition of clock gene expression by TNF and IL-1β.
(A) Expression of clock genes in NIH-3T3 cells treated with TNF (10 ng/ml), IL-1β (10 ng/ml) and TGFβ2 (2 ng/ml) for 4 hr. Data of RT-qPCR assays of Dbp, Per1, Per2, Per3, and Twist1 mRNA expression show the mean +/- SEM (error bars) of triplicates from three independent experiments. (B) Effect of cytokines on clock genes in NIH-3T3 cells (upper panel) and HT22 cells (lower panel), the cells being pretreated with siRNA against Twist1. (siTwist1 ). (C) Western blot of lysates from NIH-3T3 cells, which were pretreated with siRNA against Twist1 and thereafter with TNF for 4 hr. Matrix protein p84 was used as loading control. (D) Intensity of bands, which are shown in Fig 2C by Western blot. The data are given as ratio of untreated versus treated cells. Untreated lanes were set as 1. The concentrations of the cytokines used in the experiments are given in legend to Fig 1C. Significance of RT-qPCR data was calculated with two way-ANOVA and Bonferroni post-hoc test;* p<0.01, ** p<0.01, *** p<0.001. Western blot shows one representative experiment of three.

