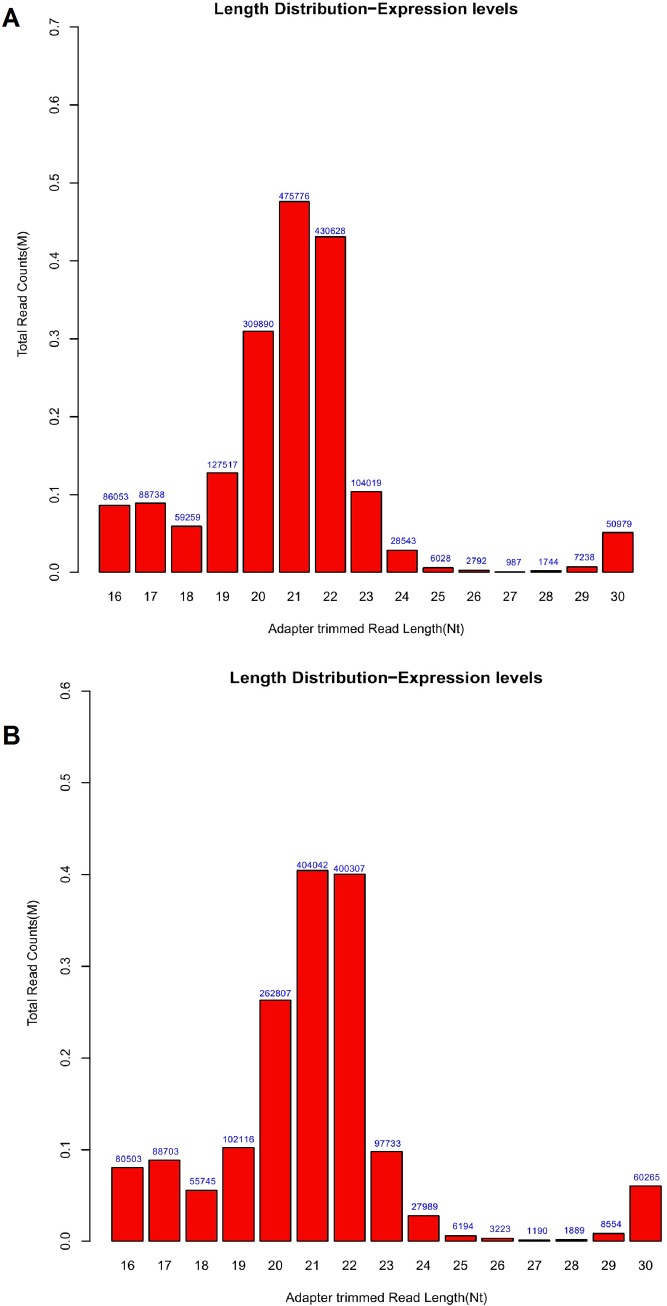
Fig 2. Length distribution of total small RNAs in PD and control flies.
The distribution of small RNAs in control (A) and PD flies (B) was randomly selected from the data of 3 biological repeats for each group. The horizontal axis means the total read counts and vertical means the read lengths for the complete adapter-trimmed read set.

