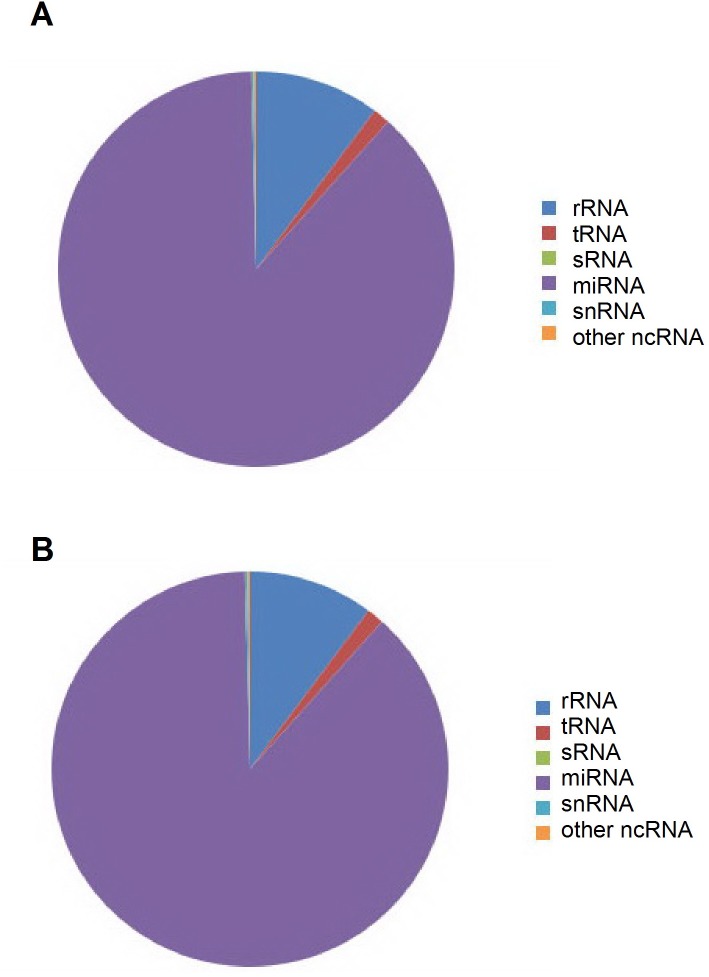
Fig 3. Frequency of different classes of RNA in small RNA libraries.
The pie-charts represent an overview of small RNA expression in control (A) and PD flies (B). Data were random selected from 3 biological repeats for each group. Small RNAs belonging to the miRNA constitute the majority as in control (89.5%) (top) and PD (88%) (bottom) samples.

