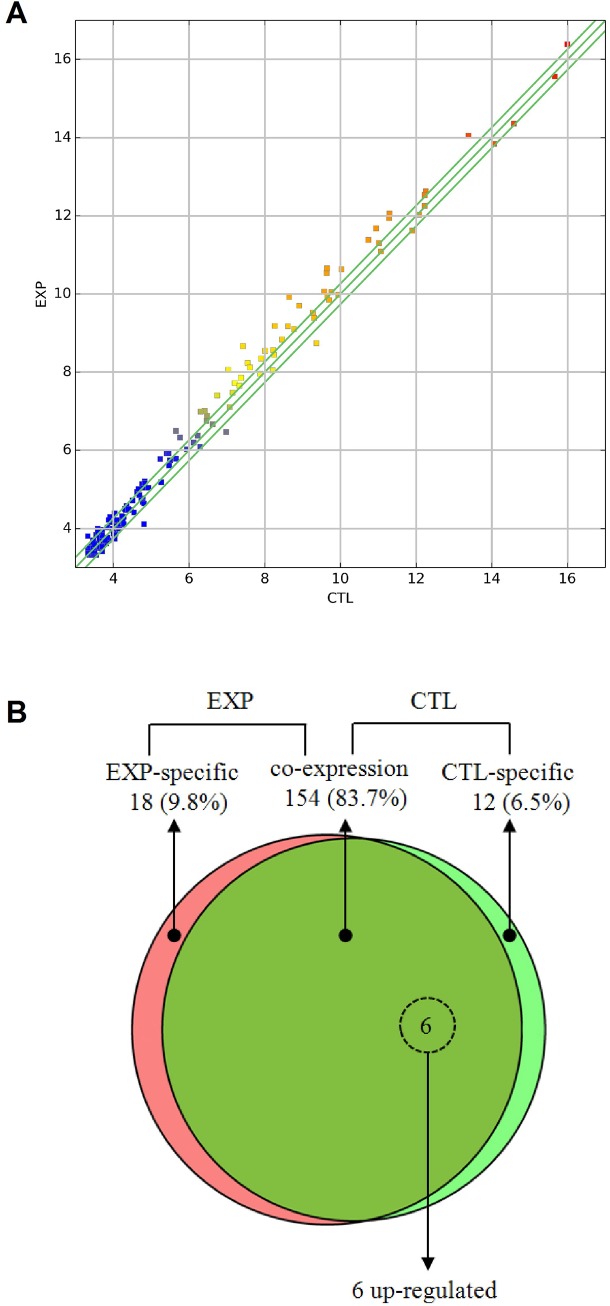
Fig 4. Differential expression analysis of miRNA.
(A) The differentially expressed miRNAs are graphed on thescatter plot to visualize variations in miRNA expression between control and PD flies (3 biological repeats for each genotype). The values on the X-axis and Y-axis of the scatter plot are the normalized values for control and PD flies (log2 scaled). The green lines are fold-change lines (default fold-change value: 1.2). (B) The Venn diagram shows the distribution of 184 unique miRNAs between PD (left, red) and control flies (right, green) libraries. The overlapping section represents 154 miRNAs coexpressed in both genotypes. The dashed circles indicated 6 miRNAs that were significantly differentially expressed (dme-mir-13b-1 and dme-mir-13b-2 shares the same mature sequence dme-miR-13b-3p).

