
Fig 2. The ROC curves for the biomarkers and the severity scores.
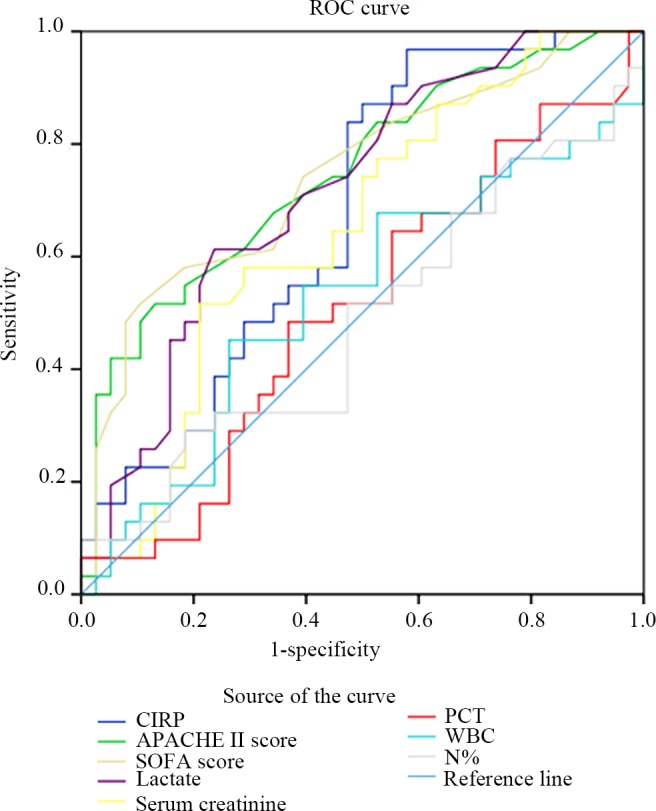
The areas under the ROC curve (AUCs) for the CIRP level, the APACHE II score, the SOFA score, the lactate level, the serum creatinine level, the PCT level, the WBC count, and the N% are shown.