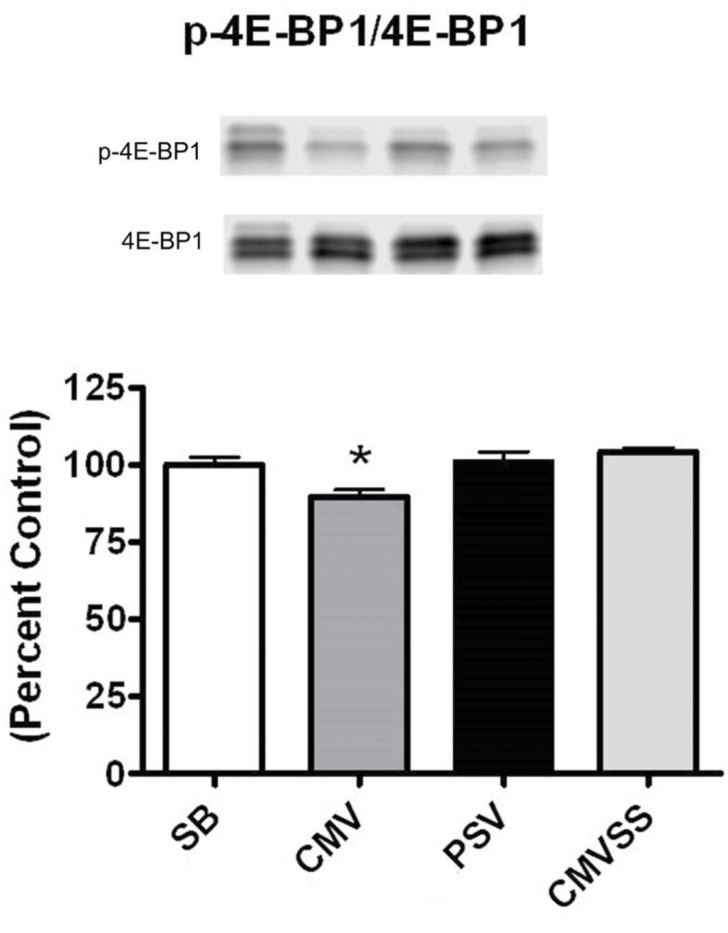
Fig 6. Ratio of p-4E-BP1 to total 4E-BP1 protein in the diaphragm following 12 hours of spontaneous breathing or mechanical ventilation.
Representative western blots are shown below the graph. The ratio was determined via analysis of the sum total of all bands in both the phosphorylated and total blots. Values are expressed as mean ± SE change from percent control. Symbols: * significantly different (p<0.05) from all groups.

