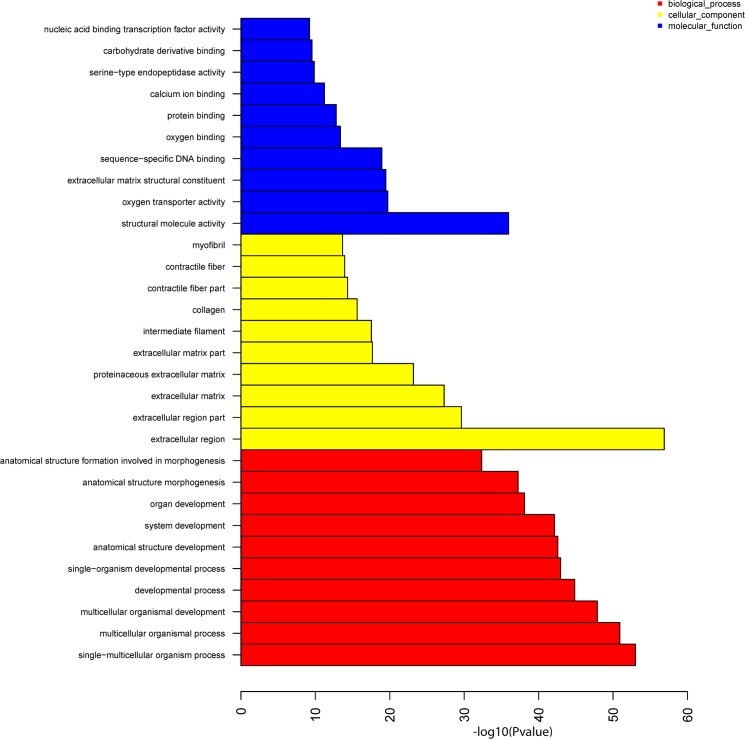
Fig 1. Histogram of the most significantly enriched GO terms obtained from the GO enrichment analysis of all DEGs.
The significance of each GO term was estimated based on the p-value (p-value < 0.05) and the FDRs (FDR ≤ 1.82E-01); blue color denotes “molecular functions”, yellow represents the “cellular component” and red the “biological process” categories.

