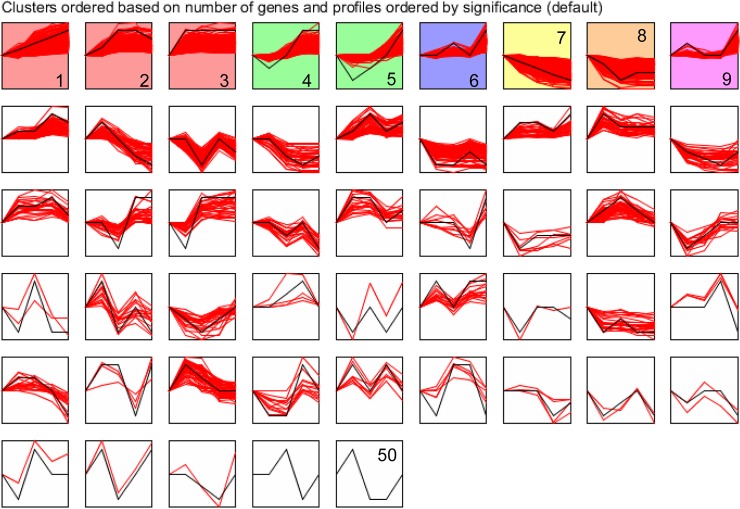
Fig 3. Expression profile and clusters of DEGs obtained from the STEM clustering.
Numbers indicated clusters or profiles. Clusters were ordered according to the number of genes while profiles were ordered according to significance. Significantly different profiles were represented by different background colors.

