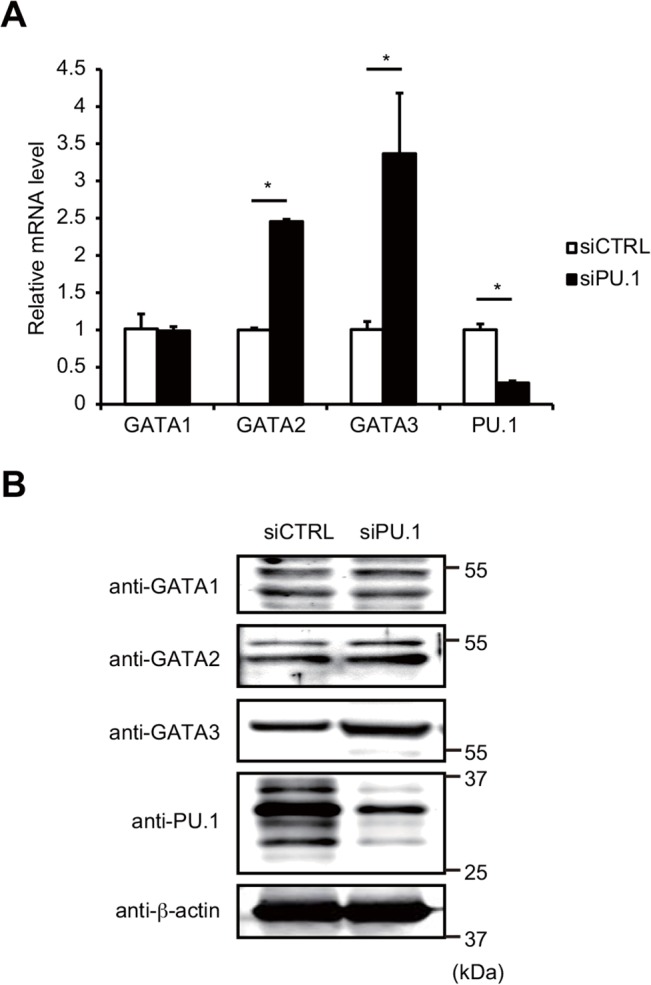
Fig 2. Effects of PU.1 knockdown on expression of GATAs, 1, 2, and 3.

(A) BMDCs were transfected with either control (siCTRL; open bars) or PU.1 (siPU.1; closed bars) siRNA. After 48 h incubation, relative mRNA levels were determined by quantitative RT-PCR after normalization to GAPDH mRNA. Data are expressed as the ratio of the expression level of respective control siRNA-introduced cells. Results are means ± S.E.s (n = 3). Similar results were obtained in three separate experiments. *, p < 0.05 in two-tailed paired Student’s t test. (B) Aliquots of total proteins (15 μg/lane) of the indicated cells were subjected to SDS-PAGE and immunoblot analysis using the indicated antibodies. Similar results were obtained in three separate experiments.
