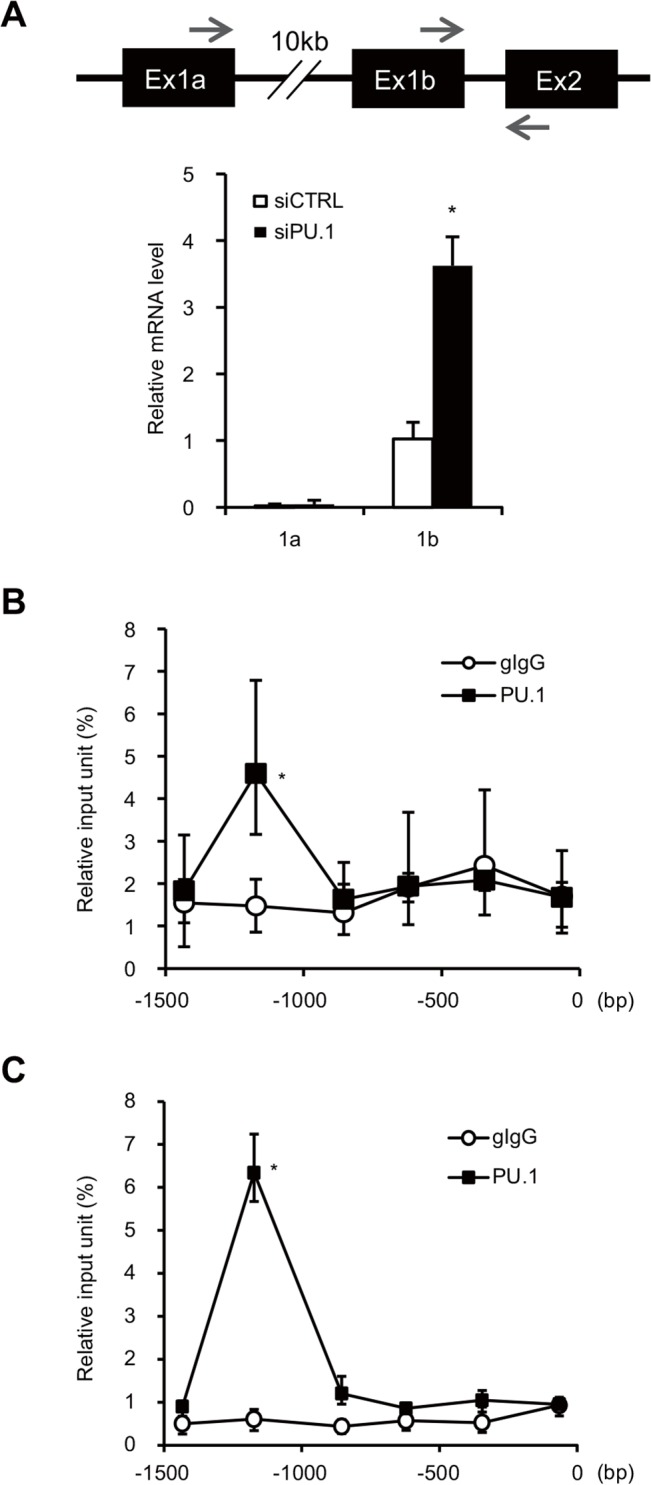
Fig 4. PU.1 binds to the Gata3-1b promoter.

(A) Upper carton: Schematic drawing of the mouse Gata3 gene. Ex, exon; the arrows over exons 1a/1b and that under exon 2, indicate forward and reverse PCR primers, respectively. Lower graph: BMDCs were transfected with either control siRNA (siCTRL) or PU.1 siRNA (siPU.1). Relative mRNA levels (1a/GAPDH or 1b/GAPDH) were determined by quantitative RT-PCR after normalization to GAPDH mRNA and are expressed as the ratio of the expression level of GATA3-1b in control siRNA-introduced cells. (B, C) Quantification of PU.1 or control goat IgG binding to the Gata3-1b promoter in BMDCs (B) or in splenic DCs (C) was performed using a ChIP assay with the series of primers described in S1 Table. Binding is expressed as a percentage of the input for each ChIP assay. All results are means ± S.E.s (n = 3). Similar results were obtained in three separate experiments. *, p < 0.05 in a two-tailed paired Student’s t test.
