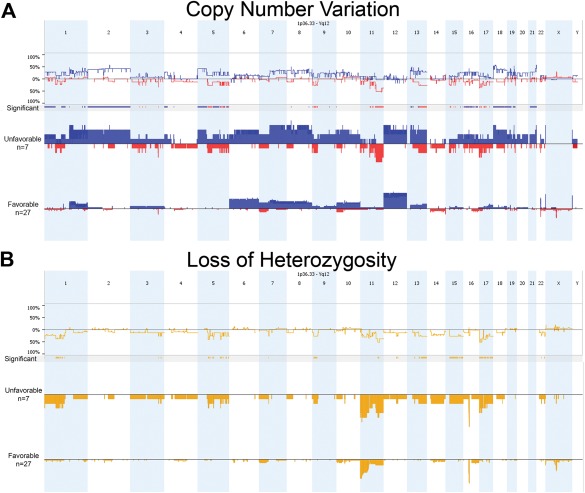
Figure 3.

Comparison of copy number variation (A) and LOH (B) across the Kenyan WT genome between unfavorable (UH) and favorable (FH) histology specimens. As expected, UH specimens show greater variability relative to FH, as depicted by significant regions. [Color figure can be viewed in the online issue, which is available at wileyonlinelibrary.com.]
