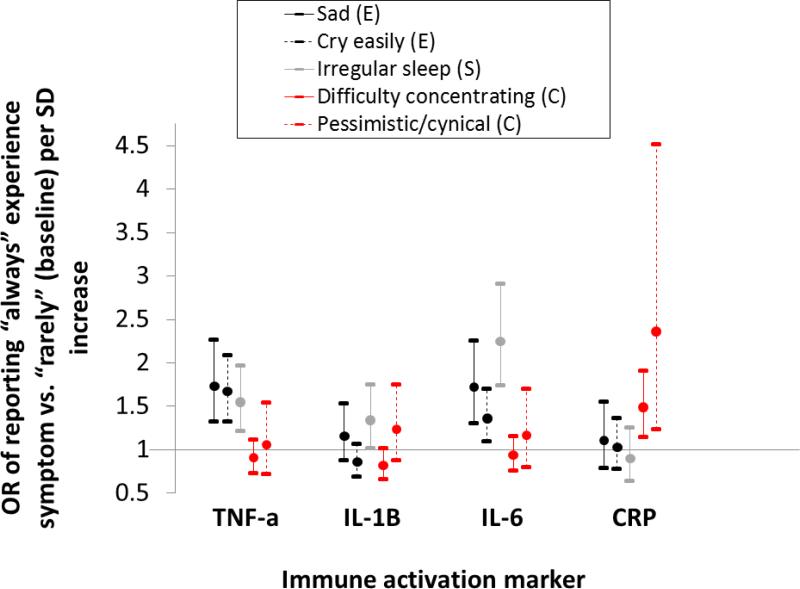
Figure 1.
OR (95% CI) of reporting “always” experiencing a symptom compared to “rarely” per SD increase in cytokine or CRP concentration (logged). Estimates are derived from multinomial logistic regression controlling for age, age2 (if p≤ 0.1), sex, BMI, and region. Symptoms are categorized by whether they include emotional (E, black line), somatic (S, gray), or cognitive (C, red) components.

