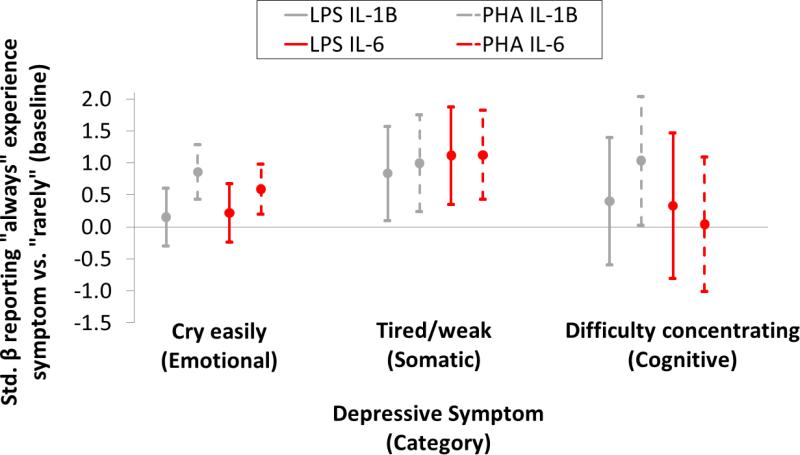
Figure 2.
Standardized β(95% CI) from OLS regression of the effect of depression item score on cytokine response to ex vivo antigen stimulation. Estimates represent the change in stimulated cytokine response from reporting “always” experiencing a symptom compared to “rarely” controlling for age, sex, BMI, and unstimulated serum cytokine concentration. Stimulated cytokine response is standardized by leukocyte count. Cytokine concentrations (unstimulated and stimulated) are logged to normalize distributions. Gray lines represent IL-1β and red lines IL-6 (solid lines=LPS stimulation, dashed=PHA).

