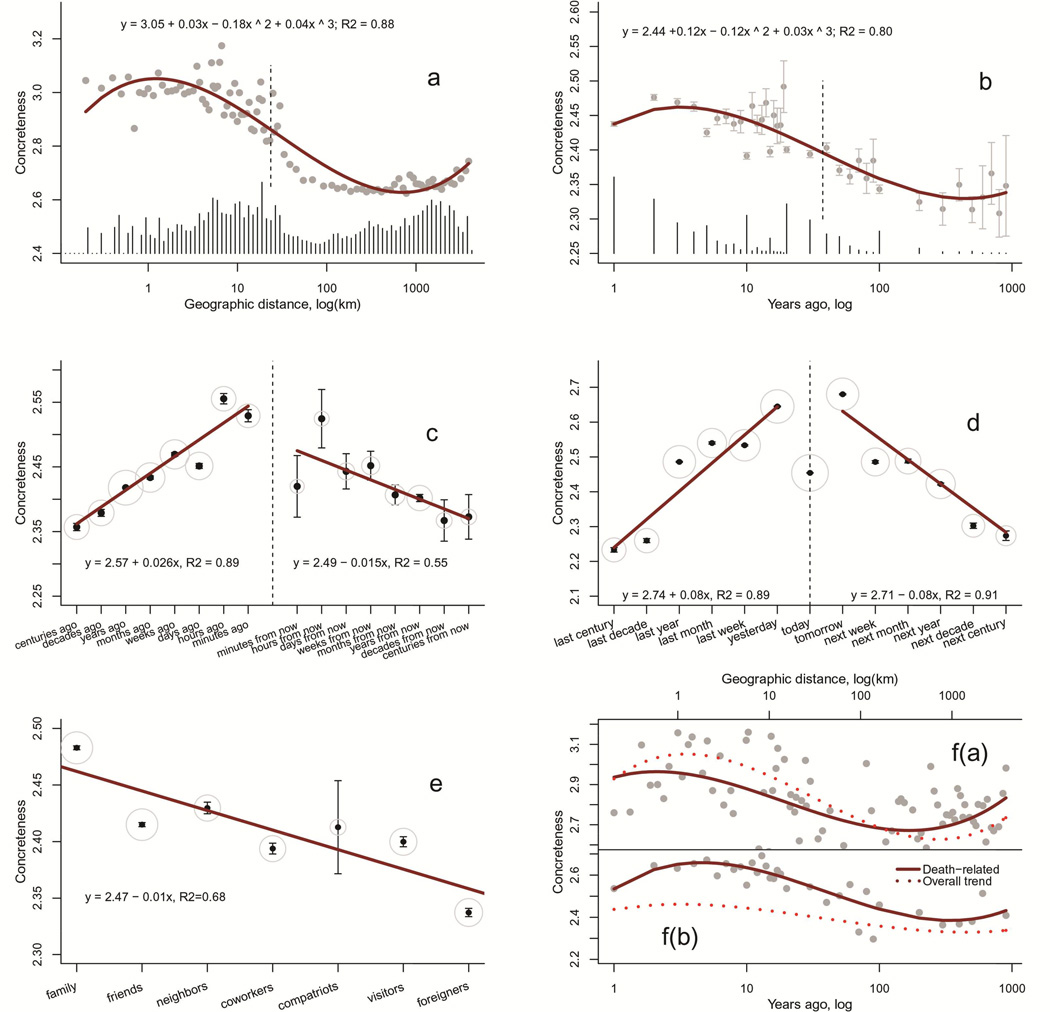
Figure 1.
Panel A: Concreteness of Twitter messages regarding US cities as a function of log geographic distance (km). Panels B-E: Concreteness of USENET postings as (Panel B) a function of log temporal distance from 1 to 999 years; (Panel C) a function of time units in the past (units ago) and the future (units from now); (Panel D) a function of ordered time units in the past (last unit) and the future (next unit); and (Panel E) a function of social distance categories. In A and B, the dotted line represents the inflection point and the histogram of distances is presented in the bottom. In C-E, gray circle size is proportional to log 10 frequency of the term. In all panels, the best-fit regression line and equation are provided, and error bars (where visible) reflect the 95% confidence intervals. Panel F plots (a) concreteness of death-related Twitter messages regarding US cities (solid line) and concreteness of all Twitter messages replicated from Panel A (dotted line); (b) concreteness of death-related USENET postings with years ago as a target phrase (solid line) and concreteness of all such USENET postings replicated from Panel B (dotted line).

