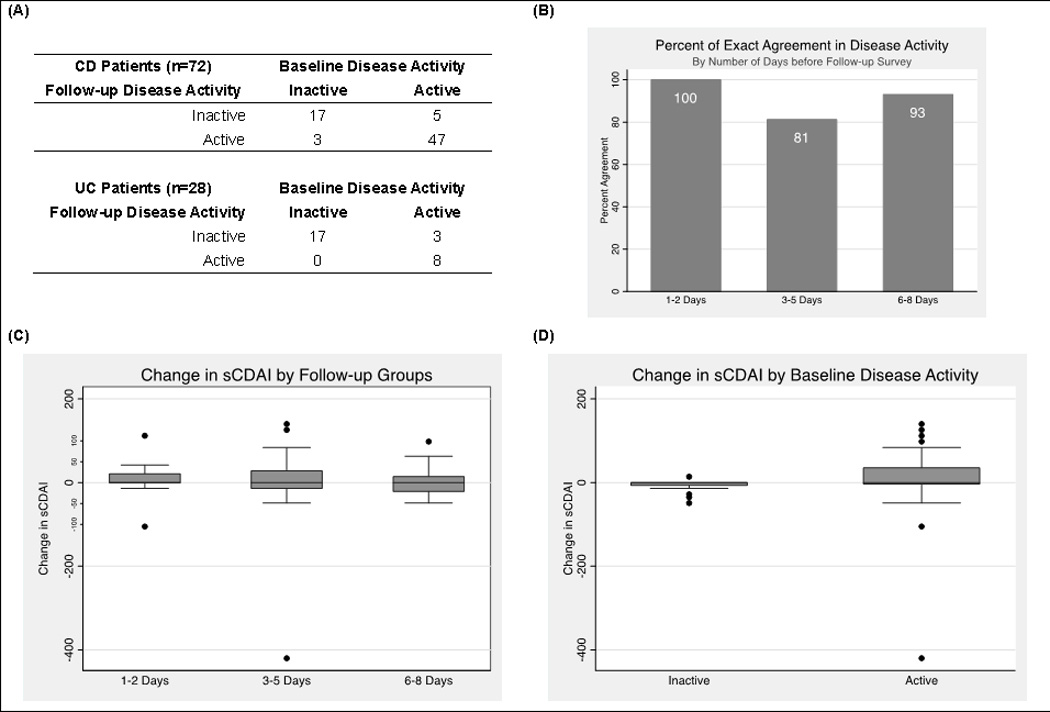
Figure 1. Changes in disease activity in study 1.

(A) The number of participants with CD (n=72) and UC (n=28) who switched from active to inactive or vice versa; (B) Percent agreement of CD activity status stratified by number of days from baseline measurement to recall of symptoms; (C and D) Box and whiskers plot of the difference of sCDAI scores at baseline and follow-up, stratified by timing of follow-up survey (C) and baseline disease activity (D).
