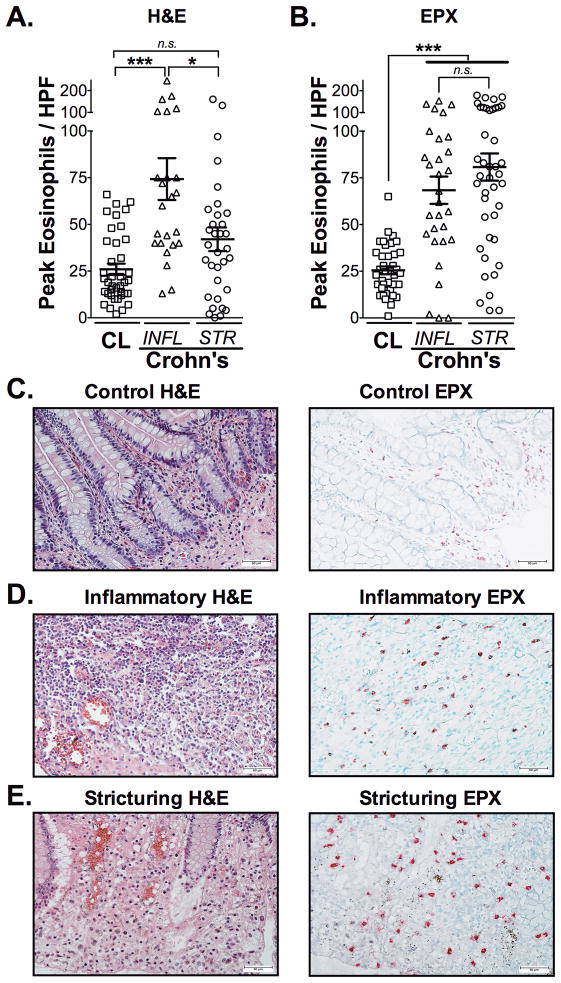
Figure 1. Eosinophil patterns are distinguishable between mucosa of inflammatory and stricturing Crohn’s disease.
Peak numbers of eosinophils were enumerated in (A) H&E and (B) Eosinophil Peroxidase (EPX)-stained ileal tissues from patients with CD. Subjects were divided into those with strictures (STR) and those without strictures that had inflammatory CD (INFL). Representative photomicrographs comparing H&E (C, E, G) to EPX-stained (D, F, H) tissues from control (CL), inflammatory and stricturing Crohn’s-ilea. Scale bars represent 50μM. Data are expressed as means ± SEM. Statistical significance was assessed by 1-way ANOVA with Newman-Keuls multiple comparisons test. *P≤0.05, ***P≤0.001.

