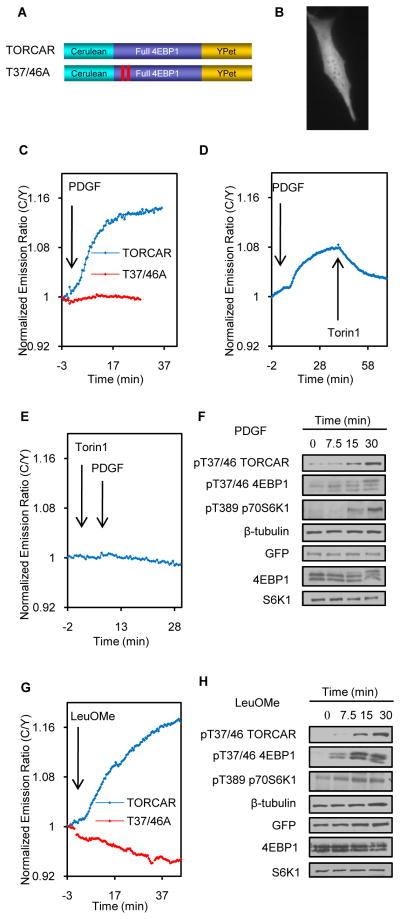
Figure 2.
Characterization of TORCAR. (A) Domain structure of TORCAR and TORCAR (T37/46A). (B) Image of an NIH3T3 cell expressing TORCAR. Scale bar = 10 μm. (C) Representative time course of the TORCAR response to PDGF. Double starved NIH3T3 cells expressing TORCAR (blue trace, mean response ± SEM as 13.3 ± 6.0%, mean t1/2 ± SEM as 12.2 ± 3.3 min, n = 33) or TORCAR-T37/46A (red trace, n = 10) were stimulated with 50 ng/ml PDGF. (D) PDGF-induced TORCAR response was reversed upon addition of torin1 (1 μM) (n = 8). (E) Pretreatment with torin1 (200 nM) abolished the PDGF-induced TORCAR response (n = 6). (F) Immunoblots showing the time-course for the phosphorylation levels of TORCAR, endogenous 4EBP1 (p-T37/46), and p70 S6K1 (p-T389) (n = 3). Double starved NIH3T3 cells expressing TORCAR were stimulated with PDGF (50 ng/ml) for the indicated times. (G) Representative time course of the TORCAR FRET response to Leucine methyl ester. Double starved NIH3T3 cells expressing TORCAR (blue trace, n = 6) or TORCAR-T37/46A (red trace, n = 5) were stimulated with 7.5 mM LeuOMe. (H) Immunoblots showed the time-course for the phosphorylation levels of TORCAR, endogenous 4EBP1 (p-T37/46), and p70 S6K1 (p-T389) (n = 3). Double starved NIH3T3 cells expressing TORCAR were stimulated with LeuOMe (7.5 mM) for the indicated times. See also Figure S2.

