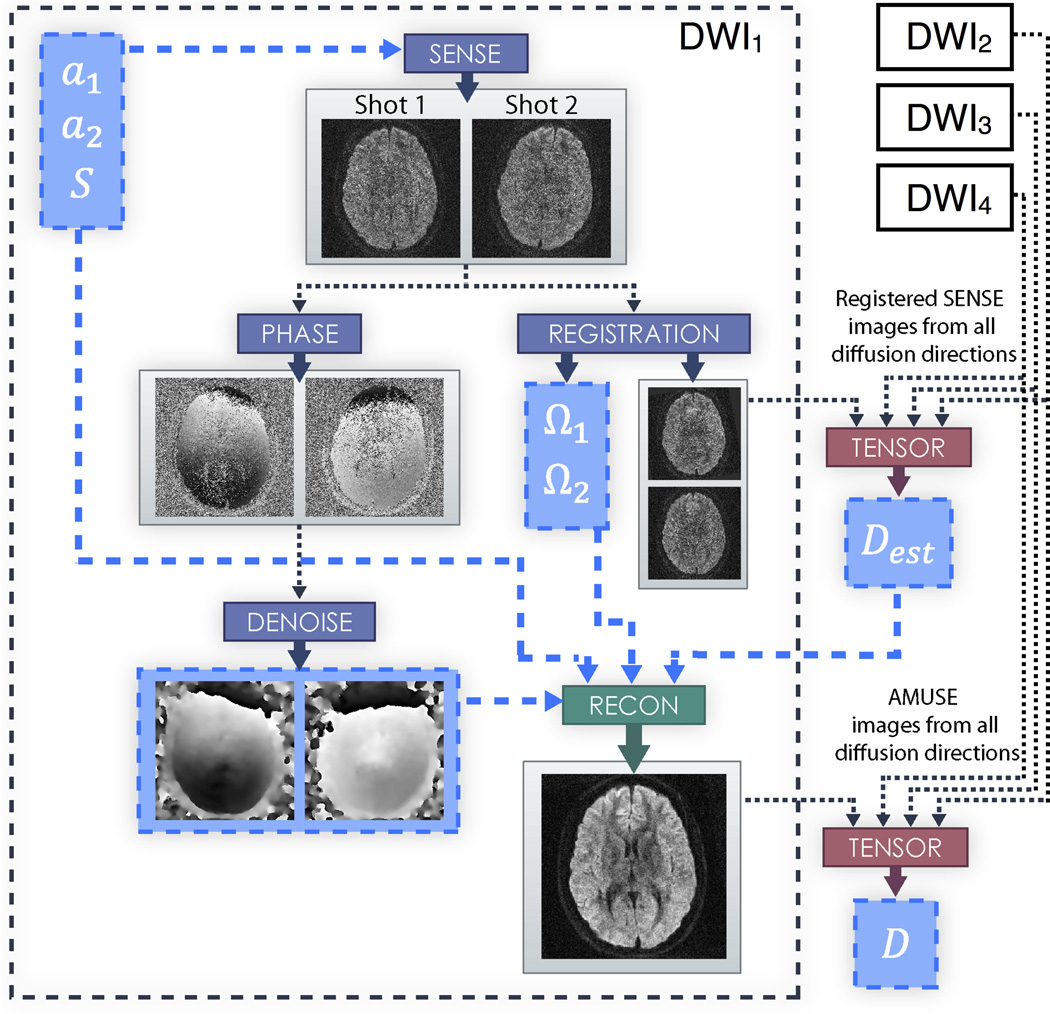
Figure 1.
Flowchart depicting the AMUSE procedure within an acquired diffusion direction for a two interleave example. a1 and a2 are the aliased signals of each interleave, and S are the coil sensitivity profiles. Ω1 and Ω2 are the macroscopic motion parameters calculated for each interleave. Dest are the initial estimates of the diffusion tensors calculated using coregistered SENSE images from all diffusion directions, and D are the final estimates of the diffusion tensors calculated using AMUSE images from all diffusion directions.

