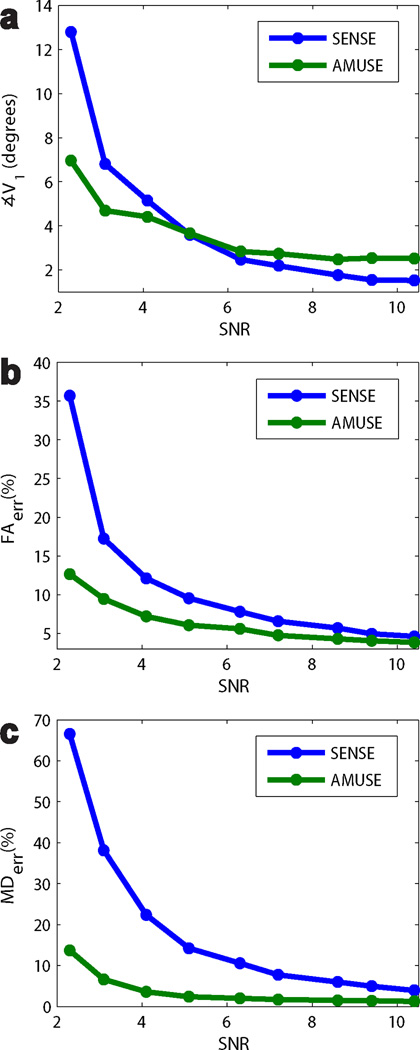
Figure 5.
Plots of ∡V1, FAerr, and MDerr of tensors from SENSE and AMUSE-DTI reconstructions at varying SNR levels in our motion simulations (αε,δ = 40 °). AMUSE-DTI produced the lowest FAerr and MDerr at all SNR levels, with increasing improvement over SENSE at lower SNRs. For ∡V1, AMUSE-DTI and SENSE performed similarly with only slight differences of a few degrees at most SNR levels. However more significant differences in ∡V1 start to become apparent at lower SNRs.

