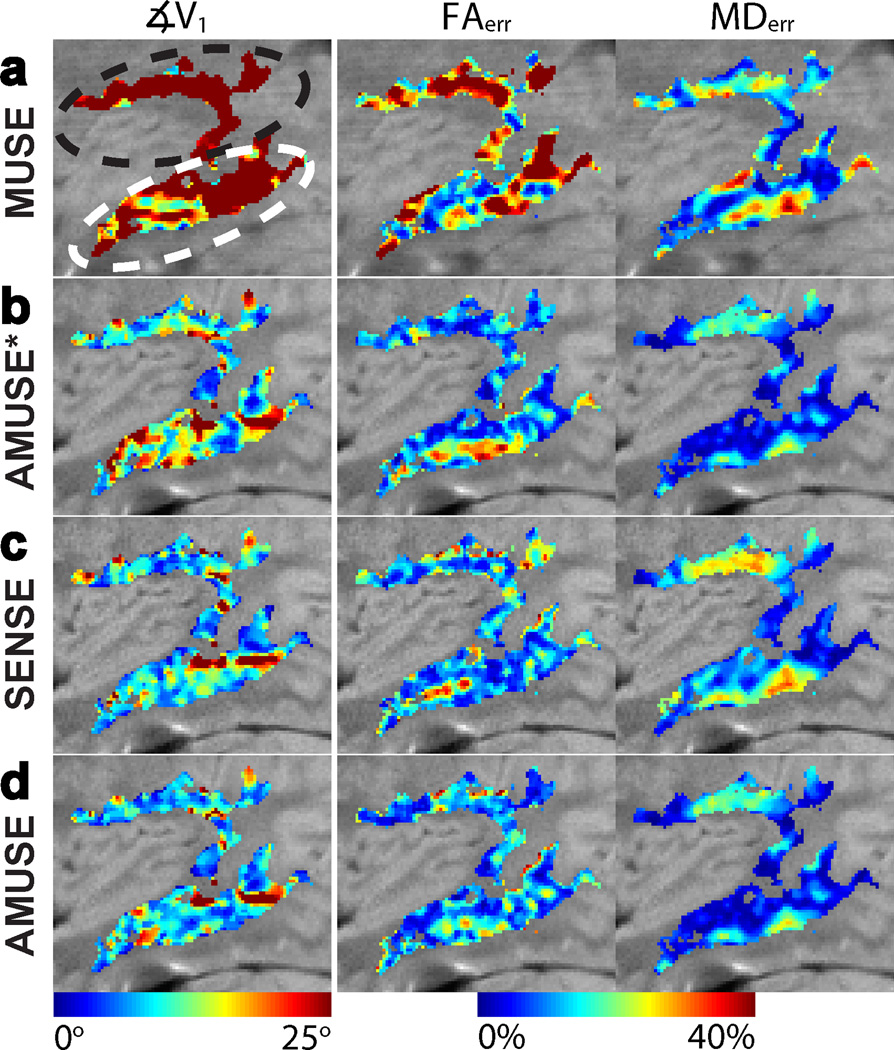
Figure 7.
Colormaps of the tensor error metrics ∡V1, FAerr, and MDerr from images reconstructed with a) MUSE, b) “AMUSE*” (AMUSE-DWI), c) SENSE-based correction, and d) “AMUSE” (AMUSE-DTI) for the in-vivo head nodding experiment from Figure 6. The metrics were calculated within the SLF (black oval) and SS (white oval) white-matter regions. Average values of these errors are given in Table 3; AMUSE-DTI produced the smallest errors considering all metrics overall.

