Figure.

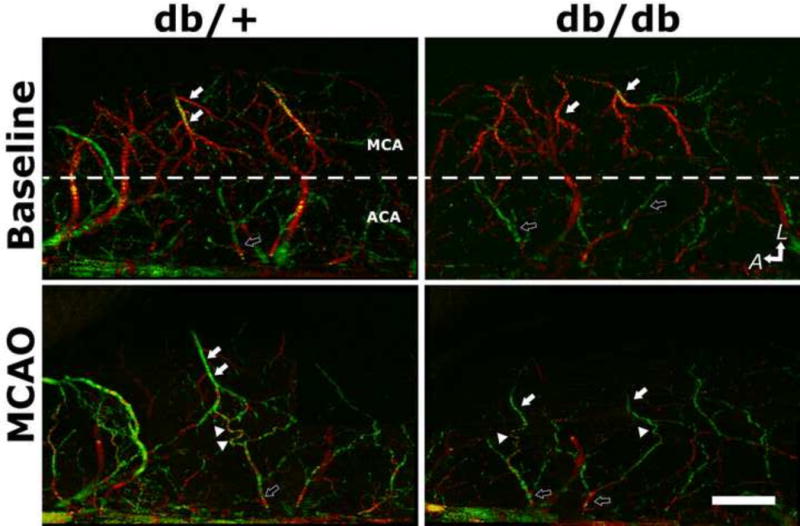
Type-II diabetes db/db mice exhibit impaired collateral flow recruitment after experimental stroke compared to their normoglycemic control db/+ mice. Retrograde collateral flow dynamics was assessed by Doppler optical coherent tomography (DOCT), a non-invasive high-resolution three-dimensional optical imaging technique for microangiography. Representative DOCT images of db/+ and db/db mice at baseline and immediately after MCAO were shown. The anatomic orientation is labeled with arrows pointing to the lateral (L) and anterior (A) directions. Dotted white lines mark the divide between MCA and ACA territory. White- and black-filled arrows indicate MCA and ACA branches, respectively. The direction of blood flow is color-coded, with the blood flowing towards the scanning probe beam or towards ACA territory coded as red, and the retrograde flow towards proximal MCA as green. Arrowheads indicate the tortuous anastomoses between MCA and ACA. Scale bar: 1 mm.
