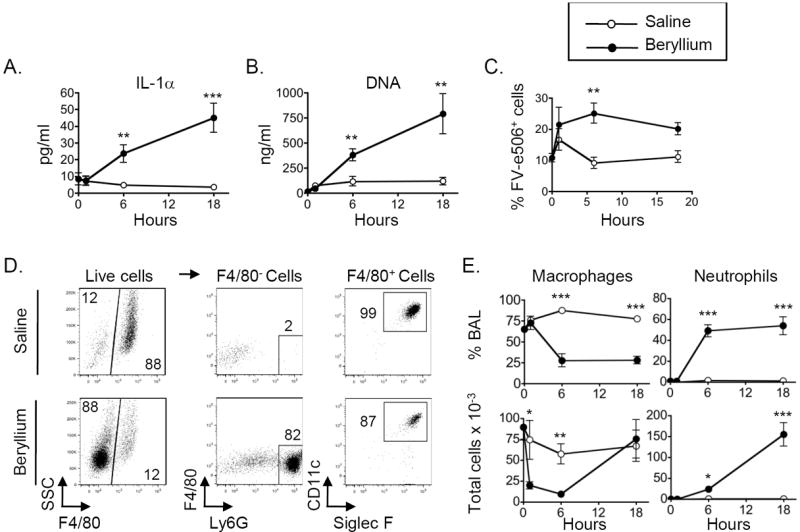
Figure 1. Beryllium exposure induces release of DNA and IL-1α and recruitment of neutrophils to the lung.

Untreated (0hrs) and mice treated with saline or Be(OH)2 i.t. were sacrificed, and BAL was harvested 1, 6 and 18hrs later. A. IL-1α levels as detected by ELISA in concentrated BALF. B. Concentration of extracellular DNA in BALF. C. Percentage (mean ± SEM) of BAL cells that are FV-e506+. D. A representative example of the gating strategy used to identify live alveolar macrophages and neutrophils after exposure to saline or Be(OH)2 for 6hrs. Gated live cells (FV-e506- as shown if Fig S1A) were analyzed to identify alveolar macrophages and neutrophils. BAL cells were gated on F4/80- and F4/80+ populations (left column). F4/80- cells that were Ly6Ghi were included in the neutrophil gate (middle column). F4/80+ cells that expressed CD11c and Siglec F were included in the alveolar macrophage gate (right column). Numbers on graphs indicate percentage of the gated population falling within each gate. E. The percentage (upper panels) and total cell numbers (lower panels) of BAL alveolar macrophages and neutrophils are shown for each time point compared to baseline (untreated mice, time 0). Total number of cells × 10-3 = number indicated on the axis. Data in A-C and E are combined from two independent experiments (n = 4 mice per group in each experiment). Values on graphs indicate mean ± SEM. A t-test was used to detect differences between treatment groups at each time point. Significance levels are indicated by asterisks (* p < 0.05, ** p < 0.01, *** p < 0.001).
