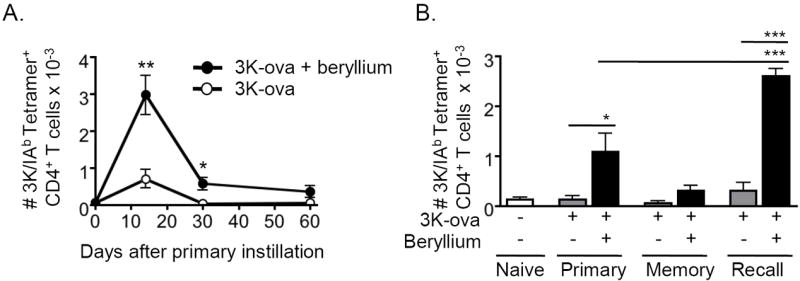
Figure 4. Beryllium-activated DCs prime CD4+ T cells.

A. WT B6 mice were treated i.t. with nothing (day 0), 3K-ova (open circles) or 3K-ova + beryllium (solid circles) and sacrificed at the indicated time points to analyze the kinetics of the 3K-specific CD4+ T cell response in the LDLNs. LDLNs were harvested and analyzed for the presence of CD4+ T cells that were CD44hi and 3K/IAb tetramer+. The total number of 3K-specific CD4+ T cells (mean ± SEM) in the LDLNs at each indicated time point during the primary response is shown. Data are a representative of 2 independent experiments (n = 4 mice per group). B. Mice were treated with nothing (open bars), 3K-ova (grey bars), or 3K-ova + beryllium (black bars). One cohort of mice (recall) was boosted on day 40 with the same treatment that was used for priming. Mice were sacrificed on day 7 of the primary response (primary), day 47 of the memory response (memory) or 7 days after boosting (recall). Total number (mean ± SEM) of 3K-tetramer+ CD4+ T cells was determined as in A. Data are from a single representative experiment of 2 (n = 4 mice per group). A one-way ANOVA was used to detect differences between groups. Significance levels are indicated by asterisks (* p < 0.05, ** p < 0.01, *** p < 0.001).
