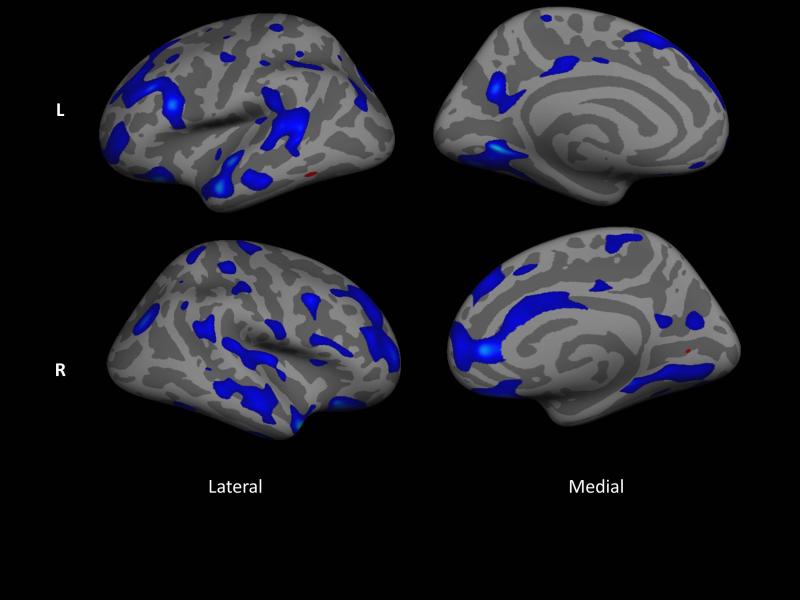
Figure 2.
Areas of cortex that are significantly related (p < .05) to the log of the ratio of total tau to aβ, correcting for time between CSF collection and scan, for 15 PD participants with CSF biomarkers. Data are uncorrected for multiple comparisons. Blue regions have decreasing thickness with increasing ratio. Note that this statistical map represents data from both sessions as analyzed in a multilevel model.

