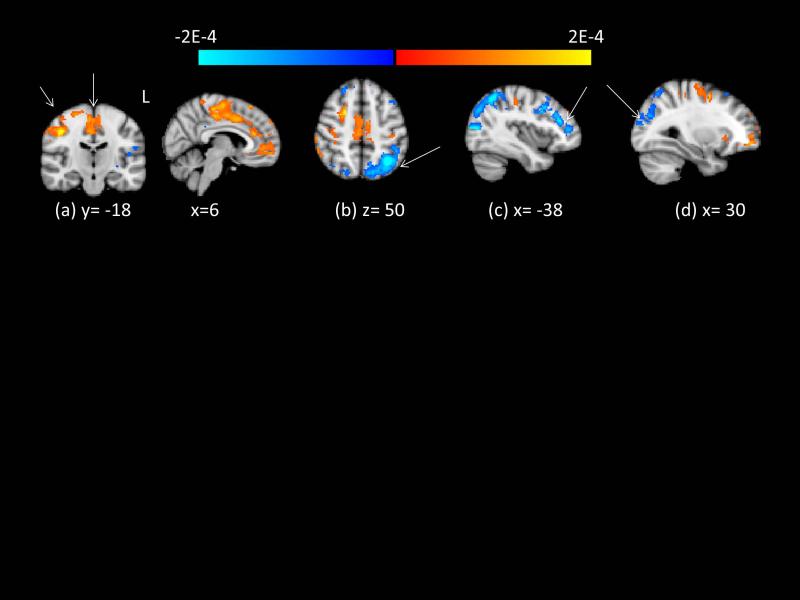
Figure 3.
Group differences in relative cerebral perfusion, computed across both sessions, correcting for grey matter partial volume. Clusters indicated by arrows survive Monte Carlo null- Z correction for multiple comparisons at p < .05. Red/yellow regions indicate greater relative perfusion in PD. Blue/light blue regions indicate lower relative perfusion in PD. Intensity of color indicates log of p-statistic. (a) R pre/postcentral gyrus, shown in coronal and sagittal views (b) L lateral occipital gyrus/superior parietal lobule (c) L middle frontal gyrus (d) R lateral occipital gyrus/angular gyrus.

