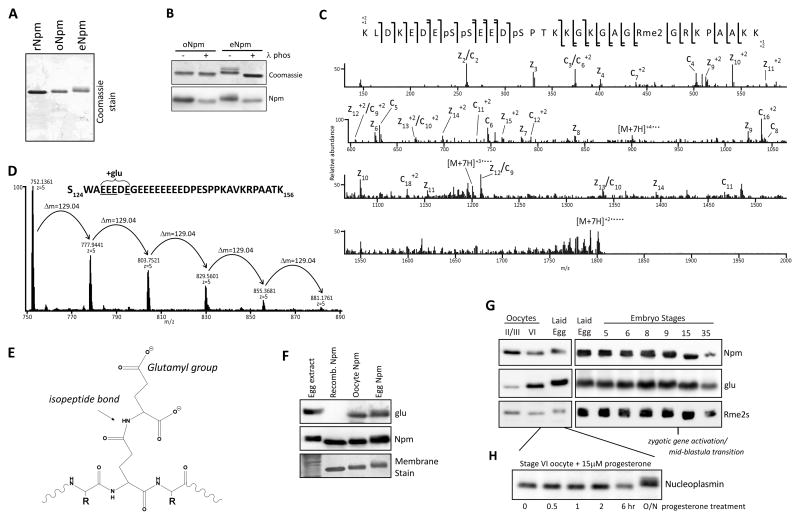
Figure 1. Npm PTM identification and characterization.
A. Purified rNpm, oNpm, and eNpm. oNpm and eNpm both show mobility shift compared to rNpm. B. λ-phosphatase treatment of purified oNpm and eNpm. The collapsed gel retardation confirms the shift is due to phosphorylation. C. Low resolution ETD MS/MS spectrum of the [M+7H]7+ charge state of K165-K195 peptide of oNpm. Complete localization of all PTMs is apparent from the sequence coverage map (top). D. Averaged full MS spectrum of Npm S124-K156 from oocyte displaying the distribution of polyglutamylation within the region of E127-E131. Δm=129.04 Da indicates an addition of a single glutamyl group. E. Chemical structure of a glutamylated peptide on a backbone glutamate reveals the increased and wider distribution of negative charge. F. Immunoblot of egg extract and purified rNpm, oNpm, and eNpm confirms glutamylation on oNpm and eNpm in vivo. G. Immunoblot of oocyte, laid egg, and embryo lysates probing for glutamylation and arginine symmetric dimethylation. H. Hyperphosphorylation of Npm occurred after overnight incubation of oocytes in progesterone to promote maturation and GVBD. Also See Figure S1.

