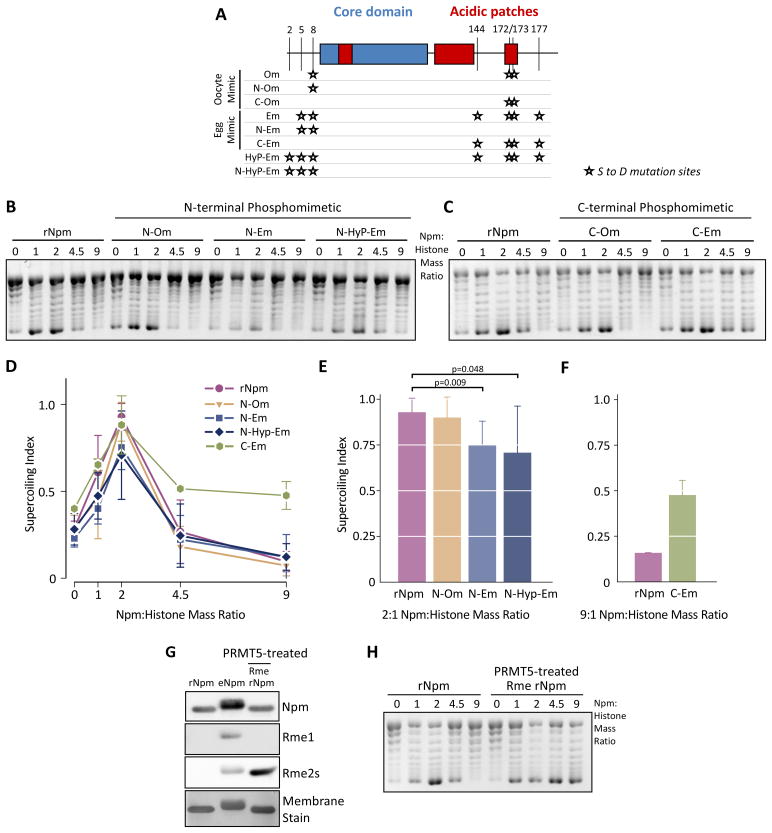
Figure 6. N- and C-terminal PTMs distinctly regulate Npm histone deposition.
A. Schematic showing the Npm Ser-to-Asp phosphomimetic mutations we prepared. The mutation sites (★) are indicated by residue number (top) and the mutant protein name (left). B. Chromatin assembly assay using N-terminal phosphomimetic mutant Npm proteins. C. Chromatin assembly assay using C-terminal phosphomimetic mutant Npm proteins. D. Supercoiling index of (B) represented as in Figure 3D. The normalized mean of seven replicates ± s.d. is shown. E. Supercoiling index of (B) at 2:1 mass ratio is shown. p values (top) were calculated using Student’s t-test. F. The quantification of C-Em and rNpm at 9:1 mass ratio are shown. The result represents the normalized mean of two replicate ± s.d. G. rNpm, eNpm, and PRMT5-treated rNpm were immunoblotted for mono- (Rme1) and symmetric dimethylarginine (Rme2s) as shown. H. Chromatin assembly assay using rNpm and PRMT5-treated rNpm. Also See Figure S6.

