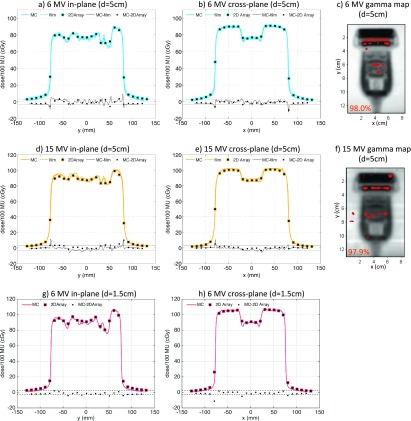
FIG. 4.
Comparison of MC simulations and dose measurements for the X6-1 probe in horizontal orientation for 6 MV (top row—5 cm depth, bottom row—1.5 cm depth) and 15 MV (middle row—5 cm depth) beams. The in-plane [(a), (d), and (g)] and cross-plane [(b), (e), and (h)] dose profiles and dose differences are shown with the ±3% difference line plotted for reference. Gamma maps comparing MC simulations and film measurements with 3%/3 mm passing criteria (failing pixels with gamma >1 are shown) and the pixel percentage passing rates are shown for the 5-cm depth 6 MV (c) and 15 MV (f) beams.

